场景:
线上环境出现办件列表查询非常慢大概要1分钟才刷出来,及很多功能都出现系统性卡顿。
环境:
oracle数据库,工作表历史表act_hi_proinst单表数据量一百多万
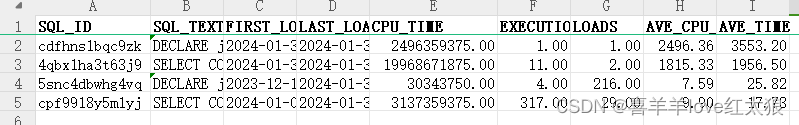
慢sql查询一:
select *
from (select v.sql_id,
v.sql_text,
v.sql_fulltext,
v.first_load_time,
v.last_load_time,
v.elapsed_time,
v.cpu_time,
v.disk_reads,
v.executions,
v.loads,
v.cpu_time / v.executions / 1000 / 1000 ave_cpu_time,
v.elapsed_time / v.executions / 1000 / 1000 ave_time
from v$sql v) a
where a.last_load_time > '2024-01-01/00:00:00'  and ave_time > 5 and a.executions > 0 order by ave_time desc;
其中各字段含义如下:
- v.sql_text: 包含sql语句的文本内容
- v.sql_fulltext: 包含完整的sql语句文本内容
- v.first_load_time: sql语句第一次加载到共享池中的时间
- v.last_load_time: sql语句最后一次加载到共享池中的时间
- v.elapsed_time: sql语句的总执行时间(以微秒为单位)
- v.cpu_time: sql语句的总cpu执行时间(以微秒为单位)
- v.disk_reads: sql语句的总磁盘读取次数
- v.executions: sql语句的总执行次数
- v.loads: sql语句的总加载次数
- ave_cpu_time: 每次执行的平均cpu执行时间(以秒为单位)
- ave_time: 每次执行的平均总执行时间(以秒为单位)
问题一:办件列表查询慢
办件查询列表主要涉及到如下两个sql语句
    select * from (
     select a.*,rownum as num from (
       select res.* ,h.name_ as bizname, h.xzq_ as bizxzq, h.due_date_ as bizduedate, h.proc_def_key_ as bizprocdefkey,
      h.category_ as bizcategory, h.datum_type_ as bizdatumtype, h.start_user_id_ as bizstartuserid, h.dept_code_ as bizdeptcode,
      h.f1_ as bizf1, h.f2_ as bizf2, h.f3_ as bizf3, h.f4_ as bizf4, h.f5_ as bizf5, h.f6_ as bizf6, h.f7_ as bizf7,
      h.f8_ as bizf8, h.f9_ as bizf9, h.f10_ as bizf10, h.f11_ as bizf11, h.f12_ as bizf12, h.f13_ as bizf13, h.f14_ as bizf14,
      h.f15_ as bizf15, h.f16_ as bizf16, h.f17_ as bizf17, h.f18_ as bizf18, h.f19_ as bizf19, h.f20_ as bizf20
	  from gisqbpm.act_hi_procinst res
	  left join gisqbpm.act_hi_biz_procinst h on  h.proc_inst_id_ = res.proc_inst_id_)a where rownum<15 )b
    where b.num>0
线上测试1.58秒
select count(res.id_)
      from gisqbpm.act_hi_procinst res, gisqbpm.act_hi_biz_procinst h
      where  h.proc_inst_id_ = res.proc_inst_id_;
但是分页查询总数的sql语句执行五次,5.932s,3.78s,2.89s, 2.5s,1.9s
分析:
原因是前端刚打开办件查询列表时,由于查询总数的sql语句,没有任何过滤条件导致两种表只有关联查询并没有过滤故全表扫描耗时较长。
解决方法:
由于两张关联表中数据是一对一的,因此如果仅仅考虑第一次查询慢的问题,直接可以去掉关联,单表查询的总数就可以了。
但是事与愿违,这只能解决办件查询第一进入的问题,如果有条件参数过滤的话(关联表的参数)还要加上这个关联表,后端改动有点大。
因此建议线上前端处理办件查询第一次进入时带上时间范围。
问题二:系统性卡顿
描述也不算是系统系卡顿吧,有写接口还是比较快的,只能说有很多重要的操作反应都很慢,下面是获取的当天的慢sql。
这里挑选了几个耗时较长的简单的分析(这里面的sql是另外一个部门的)
declare job binary_integer := :job; next_date date := :mydate;  broken boolean := false;
begin pro_inert_rybjlcx_sed; :mydate := next_date; if broken then :b := 1; else :b := 0; end if; end;
1.该sql执行(execution)一次 ,加载(loads)一次 平均耗时将近一个小时。执行 pro_inert_rybjlcx_sed慢
select count(0) from (select * from (select * from v_fwdyaq where 1=1) where 1=1 )
2..该sql执行(execution)11次 ,加载(loads)216次 平均每次执行耗时接近半个小时。需要对该语句重点优化
declare job binary_integer := :job; next_date date := :mydate;  broken boolean := false;
begin sms_ts; :mydate := next_date; if broken then :b := 1; else :b := 0; end if; end;
3.该sql执行(execution)四次 ,加载(loads)2次 平均每次执行耗时25秒。加载较频繁需要重点优化行 sms_ts操作
select count(distinct "a2"."qlbsm") from "bdcdj"."djfz_cqzs" "a2","bdcdj"."qlr" "a1" where "a2"."qlbsm"="a1"."qlbsm" and "a2"."qszt"=1 and trim("a2"."bdcqzh")=:1 and "a1"."qlrmc" like :24.该sql执行(execution)317次 ,加载(loads)29次 平均每次执行耗时9秒。执行和加载较频繁需要重点优化行
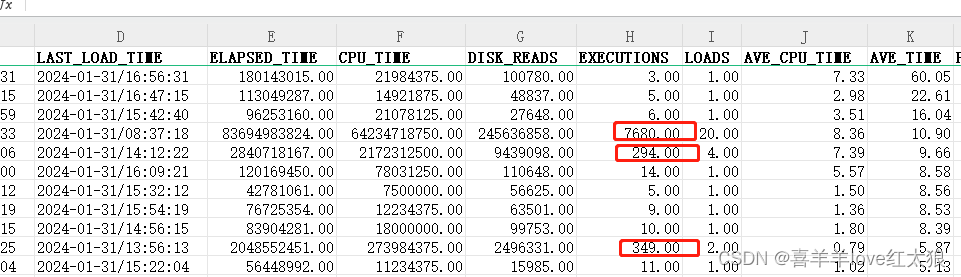
select * from ( select a.*, rownum rnum from ( select res.*, h.name_ as bizname, h.xzq_ as bizxzq, h.due_date_ as bizduedate, h.proc_def_key_ as bizprocdefkey, h.category_ as bizcategory, h.datum_type_ as bizdatumtype, h.start_user_id_ as bizstartuserid, h.f1_ as bizf1, h.f2_ as bizf2, h.f3_ as bizf3,h.f4_ as bizf4, h.f5_ as bizf5, h.f6_ as bizf6, h.f7_ as bizf7, h.f8_ as bizf8, h.f9_ as bizf9, h.f10_ as bizf10, h.f11_ as bizf11, h.f12_ as bizf12, h.f13_ as bizf13, h.f14_ as bizf14, h.f15_ as bizf15, h.f16_ as bizf16, h.f17_ as bizf17, h.f18_ as bizf18, h.f19_ as bizf19, h.f20_ as bizf20 from act_hi_procinst res left join act_hi_biz_procinst h on h.proc_inst_id_ = res.proc_inst_id_ where (res.delete_reason_ <> :1 or res.delete_reason_ is null) order by res.start_time_ desc ) a where rownum < :2) where rnum >= :3
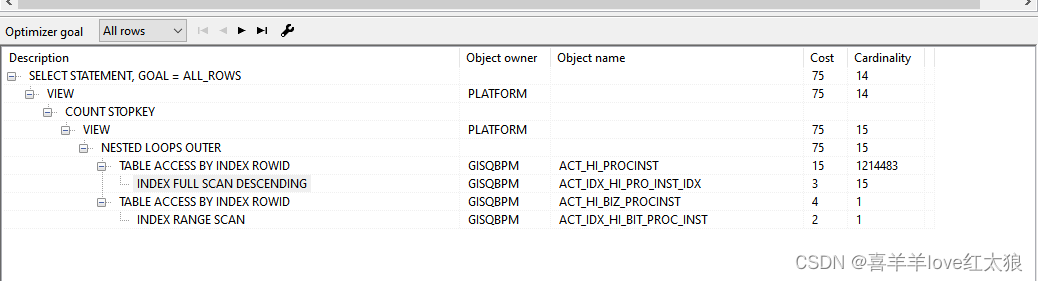
分页查询语句执行了7680次,平均每次执行10s,看sql执行计划走了时间字段,然而线上没有,线上加上索引线上执行为0.1秒
分析:
线上start_time_ 列没有走索引
解决方法:
添加索引
慢sql查询二
select *
from (select v.sql_id,
v.sql_fulltext,
v.executions,
v.elapsed_time / v.executions / 1000 / 1000 ave_time,
v.parsing_user_id,
last_load_time
from v$sql v) a
where a.last_load_time > '2024-02-01/00:00:00'  and ave_time > 5 and a.executions > 0
and a.parsing_user_id=(select user_id from all_users  where username='gisqbpm')
order by ave_time desc;
扩展:
1.loads 和execution的区别于联系?
loads:表示sql语句在共享池中被加载的次数。每当一个sql语句被解析并放入共享池中,loads的值就会增加。这个值可以帮助您了解一个sql语句被重复使用的频率。
executions:表示sql语句被执行的次数。每当一个sql语句被实际执行,executions的值就会增加。这个值可以帮助您了解一个sql语句在实际执行过程中的频率。
2. 同一个sql为什么会被重复加入到共享池
在oracle数据库中,同一个sql语句可能会被重复加入到共享池的原因有以下几点:
绑定变量不同:如果sql语句使用了绑定变量,即在sql语句中使用了占位符,那么不同的绑定变量值会导致不同的sql语句被加入到共享池中。
sql语句文本不同:即使sql语句的逻辑相同,但如果sql语句的文本不同(比如空格、大小写等),oracle也会将它们当作不同的sql语句进行处理。
不同的解析环境:在不同的解析环境下,相同的sql语句可能会被多次解析并加载到共享池中,比如在不同的会话或者不同的数据库连接中。
共享池空间不足:如果共享池空间不足,oracle可能会根据一些策略进行sql语句的淘汰和重新加载,这也会导致同一个sql语句被重复加载到共享池中。
总结
到此这篇关于oracle数据库慢查询sql的文章就介绍到这了,更多相关oracle慢查询sql内容请搜索代码网以前的文章或继续浏览下面的相关文章希望大家以后多多支持代码网!


发表评论