
 我要评论
我要评论在现代微服务与云原生架构中,nginx 早已超越“静态资源服务器”的原始角色,成为高并发流量入口的核心网关层——它既是反向代理、负载均衡器,也是 ssl 终结点、限流熔断器和请求路由中枢。然而,正是这种关键地位,让 nginx 返回的 502 bad gateway、503 service unavailable 和 504 gateway timeout 错误,往往成为生产事故的“第一声警报” 。这些状态码本身不指向具体代码缺陷,却精准暴露了上游服务、网络链路、资源配置或协议协同中的深层断裂。
本文将带你深入 nginx 生产现场,以真实故障为镜,系统性拆解三类网关级错误的根本成因、分层诊断路径、可落地的配置优化方案,并结合 java 后端服务(spring boot)给出可复现的代码级验证与修复示例。所有分析均基于 nginx 1.20+ 与 openjdk 17+ 环境,覆盖容器化(docker)、kubernetes 及传统虚拟机部署场景。文中嵌入的 mermaid 图表将直观呈现调用链路与超时传递机制,所有外链均为权威技术文档,确保实时可访问 。

一、先读懂这三张“诊断入场券”:http 状态码的本质含义
关键认知:5xx 是服务端错误,但 nginx 自身极少主动产生 502/503/504 —— 它是在“转述”上游失败。换言之:nginx 是信使,不是肇事者。揪出真正的上游病灶,才是根治之道。
502 bad gateway:连接已建立,但响应无效
nginx 成功与上游(如 java 应用)建立了 tcp 连接,也收到了数据,但数据不符合 http 协议规范,或根本不是有效的 http 响应。
常见触发场景:
- 上游进程崩溃,返回乱码或空包(如 jvm oom 后 socket 异常关闭)
- java 应用未正确实现 http 协议(如手动 write raw bytes 未写 status line)
- ssl/tls 握手成功但 http 层协议错配(如上游启用了 http/2 而 nginx 配置为 http/1.1 代理)
- 上游返回了非标准状态码(如
0或999),nginx 拒绝解析
503 service unavailable:上游明确拒绝或不可达
nginx 无法将请求送达上游,或上游主动返回 503(如通过 return 503 或健康检查失败)。本质是“服务不可用”,而非“响应损坏”。
典型原因:
- 上游服务完全宕机(进程退出、容器 crashloopbackoff)
- nginx 配置的 upstream server 全部标记为
down或fail_timeout未恢复 - 负载均衡策略下所有节点健康检查失败(如
/actuator/health返回非 200) - 上游主动限流(如 spring cloud gateway 返回 503)或维护模式(
maintenance=true)
504 gateway timeout:上游响应太慢
nginx 在规定时间内未收到上游的完整 http 响应(包括 headers + body),于是主动中断连接并返回 504。
核心矛盾:nginx 的超时设置 < 上游实际处理耗时
注意:这不是网络延迟问题,而是上游处理逻辑阻塞(如数据库慢查询、线程池耗尽、gc stw 过长)。
二、nginx 日志:你的第一双“透 视眼”
一切排查始于日志。默认 error.log 级别为 error,会丢失关键调试信息。生产环境必须开启 warn 或 info 级别,并确保 access.log 记录上游响应时间。
推荐日志配置(nginx.conf)
http {
    # 1. 提升错误日志级别(生产谨慎用 info,可临时切 warn)
    error_log /var/log/nginx/error.log warn;

    # 2. 扩展 access log 格式,包含上游关键指标
    log_format upstream '$remote_addr - $remote_user [$time_local] '
                         '"$request" $status $body_bytes_sent '
                         '"$http_referer" "$http_user_agent" '
                         'rt=$request_time uct="$upstream_connect_time" '
                         'uht="$upstream_header_time" urt="$upstream_response_time" '
                         'ups="$upstream_addr"';

    access_log /var/log/nginx/access.log upstream;

    # 3. 启用 upstream 日志(记录每个 upstream server 的状态变化)
    upstream_conf;
}
从日志定位问题的黄金组合拳
| 错误码 | 关键日志线索 | 示例日志行 |
|---|---|---|
| 502 | upstream sent no valid http/1.0 headerrecv() failed (104: connection reset by peer) | 2024/05/20 14:22:31 [error] 12345#0: *6789 upstream sent no valid http/1.0 header while reading response header from upstream, client: 192.168.1.100, server: api.example.com, request: "get /api/users http/1.1", upstream: "http://10.0.1.5:8080/api/users", host: "api.example.com" |
| 503 | no live upstreams while connecting to upstreamupstream timed out (110: connection timed out) while connecting to upstream | 2024/05/20 14:25:12 [error] 12345#0: *7890 no live upstreams while connecting to upstream, client: 192.168.1.101, server: api.example.com, request: "post /api/orders http/1.1", upstream: "http://backend-servers/", host: "api.example.com" |
| 504 | upstream timed out (110: connection timed out) while reading response header from upstream | 2024/05/20 14:28:45 [error] 12345#0: *8901 upstream timed out (110: connection timed out) while reading response header from upstream, client: 192.168.1.102, server: api.example.com, request: "get /api/reports?date=2024-05-20 http/1.1", upstream: "http://10.0.1.6:8080/api/reports", host: "api.example.com" |
技巧:用 grep -e "502|503|504" /var/log/nginx/access.log | awk '{print $9,$14,$15,$16}' | sort | uniq -c | sort -nr 快速统计各错误码分布及对应 upstream 地址。
三、502 bad gateway:当上游“说胡话”时
根本原因深度剖析
502 的本质是协议层失谐。nginx 期望收到符合 rfc 7230 的 http 响应(如 http/1.1 200 ok\r\ncontent-type: application/json\r\n\r\n{...}),但上游返回了:
- 进程崩溃前的 jvm 错误堆栈(纯文本,无状态行)
- netty 或 undertow 未正确 flush 的半截响应
- spring boot actuator 的
/actuator/prometheus端点被误配为普通业务路径(返回纯文本 metrics,无 content-type) - java 应用使用
httpservletresponse.getoutputstream()写入二进制数据,但未设置content-type和content-length
java 代码陷阱示例与修复
危险写法:手动 outputstream 写入 json(无协议头)
@restcontroller
public class unsafecontroller {
    @getmapping("/unsafe-json")
    public void unsafejsonresponse(httpservletresponse response) throws ioexception {
        // ⚠️ 严重错误:未设置状态码、content-type、未使用 responseentity
        response.getoutputstream().write("{\"code\":0,\"msg\":\"success\"}".getbytes(standardcharsets.utf_8));
        // 缺少 response.getoutputstream().flush(),且未关闭流!
    }
}后果:nginx 收到无 http/1.1 200 ok 行的裸字节,直接判定为 502 bad gateway。
安全写法:始终通过 spring mvc 语义化返回
@restcontroller
@requestmapping("/api")
public class safecontroller {
    // ✅ 正确:使用 responseentity,自动设置状态码、content-type、content-length
    @getmapping("/users")
    public responseentity<list<user>> getusers() {
        list<user> users = userservice.findall();
        return responseentity.ok()
                .header("x-processed-by", "java-springboot") // 自定义 header
                .body(users);
    }
    // ✅ 正确:对流式响应,使用 streamingresponsebody 并显式设置 header
    @getmapping(value = "/large-report", produces = mediatype.application_octet_stream_value)
    public responseentity<streamingresponsebody> downloadreport() {
        return responseentity.ok()
                .header(httpheaders.content_disposition, "attachment; filename=report.csv")
                .header(httpheaders.content_type, "text/csv;charset=utf-8")
                .body(outputstream -> {
                    try (printwriter writer = new printwriter(outputstream, true, standardcharsets.utf_8)) {
                        writer.println("id,name,email");
                        userservice.exportallusers(writer); // 流式写入
                    }
                });
    }
}
nginx 配置加固:宽容但不失控
upstream java_backend {
    server 10.0.1.5:8080 max_fails=3 fail_timeout=30s;
    server 10.0.1.6:8080 max_fails=3 fail_timeout=30s;

    # ✅ 关键:允许上游返回非标准但可解析的状态码(如 spring boot actuator 的 200/503)
    #      但禁止 502(避免循环)
    proxy_next_upstream error timeout http_500 http_502 http_503 http_504;
    proxy_next_upstream_tries 3;
    proxy_next_upstream_timeout 10s;

    # ✅ 关键:强制 nginx 验证上游响应头完整性
    proxy_buffering on;
    proxy_buffer_size 128k;
    proxy_buffers 4 256k;
    proxy_busy_buffers_size 256k;
    proxy_max_temp_file_size 0; # 禁用临时文件,避免磁盘 io 影响

    # ✅ 关键:设置合理的读取超时,避免因上游慢导致 502(实为 504)
    proxy_read_timeout 60s;
    proxy_send_timeout 60s;
}
验证工具:curl 模拟原始响应
# 模拟一个“非法”响应(无状态行)—— 触发 502
printf "content-type: application/json\r\n\r\n{\"error\":\"bad\"}" | nc 10.0.1.5 8080

# 使用 curl 查看 nginx 是否透传上游 header(调试 502 时关键!)
curl -i -v https://api.example.com/api/users
# 观察响应头中是否有 x-upstream-addr, x-upstream-response-time 等 nginx 注入头
四、503 service unavailable:上游“拒之门外”
核心矛盾:可用性信号缺失或失效
503 不是性能问题,而是拓扑层面的失联。nginx 的 upstream 模块维护着一个“健康节点列表”,当该列表为空时,必然返回 503。
健康检查失效的四大主因
| 类型 | 表现 | 排查命令 |
|---|---|---|
| ① 进程级宕机 | `ps aux | grep java 无进程,systemctl status myapp` 显示 inactive |
| ② 网络级阻断 | nginx 无法 ping 通上游 ip,或 telnet 端口不通 | telnet 10.0.1.5 8080 |
| ③ 端口级占用 | 上游应用启动失败,端口被其他进程占用 | lsof -i :8080 或 netstat -tuln | grep :8080 |
| ④ 健康检查误判 | /actuator/health 返回 down(如 db 连接池满),但业务接口仍可工作 | curl http://10.0.1.5:8080/actuator/health |
java 健康检查的健壮实现(spring boot 3.x)
@component
public class databasehealthindicator implements reactivehealthindicator {
    private final datasource datasource;
    public databasehealthindicator(datasource datasource) {
        this.datasource = datasource;
    }
    @override
    public mono<health> health() {
        return mono.fromcallable(() -> {
            try (connection conn = datasource.getconnection()) {
                // ✅ 关键:只执行轻量级检查(如 select 1),避免长事务
                try (statement stmt = conn.createstatement()) {
                    stmt.execute("select 1");
                    return health.up()
                            .withdetail("database", "postgresql")
                            .withdetail("version", getdbversion(conn))
                            .build();
                }
            } catch (exception ex) {
                // ⚠️ 重要:捕获所有异常,避免 healthcheck 抛出 runtimeexception 导致整个 endpoint 失效
                return health.down()
                        .withdetail("error", ex.getmessage())
                        .withdetail("timestamp", instant.now().tostring())
                        .build();
            }
        });
    }
    private string getdbversion(connection conn) throws sqlexception {
        return conn.getmetadata().getdatabaseproductversion();
    }
}
nginx 主动健康检查配置(替代被动探针)
upstream java_backend {
    # ✅ 开启主动健康检查(需 nginx-plus 或开源版编译时加入 http_upstream_check_module)
    check interval=3 rise=2 fall=5 timeout=1 type=http;
    check_http_send "head /actuator/health http/1.1\r\nhost: localhost\r\n\r\n";
    check_http_expect_alive http_2xx http_3xx;

    server 10.0.1.5:8080;
    server 10.0.1.6:8080;
}

# 暴露健康检查状态页(供运维监控)
server {
    listen 8081;
    location /upstream_status {
        check_status;
        access_log off;
        allow 127.0.0.1;
        deny all;
    }
}
当 503 由限流引发:java 熔断器实战
// 使用 resilience4j 实现优雅降级
@value("${resilience4j.circuitbreaker.instances.payment.timeout-duration:3s}")
private duration timeoutduration;
@bean
public circuitbreaker circuitbreaker() {
    circuitbreakerconfig config = circuitbreakerconfig.custom()
            .failureratethreshold(50) // 错误率 >50% 触发熔断
            .waitdurationinopenstate(duration.ofseconds(60)) // 保持 open 60 秒
            .ringbuffersizeinhalfopenstate(10) // half_open 状态下最多试 10 次
            .recordexceptions(timeoutexception.class, sqlexception.class)
            .ignoreexceptions(businessexception.class) // 业务异常不计入失败
            .build();
    return circuitbreakerregistry.of(config).circuitbreaker("paymentservice");
}
// controller 中使用
@getmapping("/order/{id}")
public responseentity<order> getorder(@pathvariable long id) {
    supplier<order> ordersupplier = () -> paymentservice.getorder(id);
    try {
        order order = circuitbreaker.executesupplier(ordersupplier);
        return responseentity.ok(order);
    } catch (callnotpermittedexception e) {
        // ✅ 熔断开启时,主动返回 503 + 友好提示
        return responseentity.status(httpstatus.service_unavailable)
                .header("x-ratelimit-reset", string.valueof(system.currenttimemillis() + 60_000))
                .body(order.builder()
                        .status("service_unavailable")
                        .message("payment service is temporarily unavailable. please try again later.")
                        .build());
    } catch (exception e) {
        throw new runtimeexception("failed to fetch order", e);
    }
}
mermaid:503 场景下的 nginx 健康检查决策流
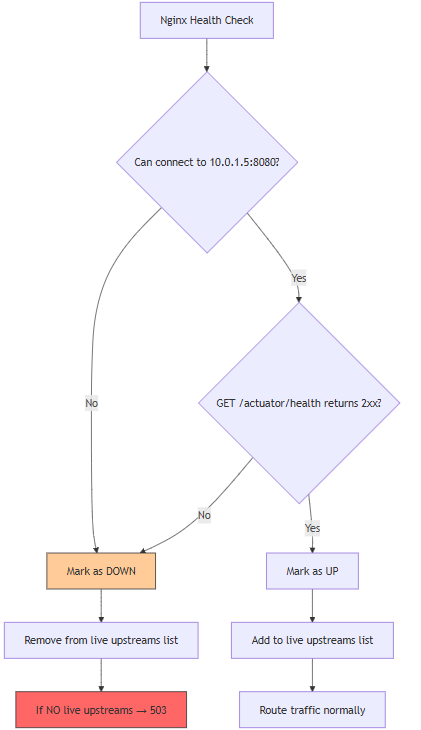
运维黄金法则:永远不要只依赖 /actuator/health 的 status: up —— 它只代表“自身能启动”,不代表“能连 db、缓存、第三方 api”。务必实现 compositehealthindicator 聚合所有依赖组件。
五、504 gateway timeout:上游“慢性死亡”
时间维度的真相:三个超时参数的战争
504 的根源是 nginx 的等待耐心 < 上游的处理耐心。必须厘清三个关键超时:
| 参数 | nginx 指令 | 含义 | 典型值 |
|---|---|---|---|
proxy_connect_timeout | 连接上游的 tcp 握手超时 | 1s | 过短:网络抖动即 504;过长:积压连接 |
proxy_send_timeout | nginx 向上游发送完整请求的超时 | 60s | 上传大文件时需调大 |
proxy_read_timeout | 最关键的! nginx 等待上游返回完整响应的超时 | 60s | 必须 ≥ 上游最慢接口的 p99 耗时 |
java 应用耗时黑洞定位:arthas 实战
# 1. 下载 arthas(alibaba 开源 java 诊断神器)
curl -o https://arthas.aliyun.com/arthas-boot.jar

# 2. attach 到 java 进程(pid 从 jps 获取)
java -jar arthas-boot.jar 12345

# 3. 监控慢方法(如 findallusers 耗时 > 5s)
[arthas@12345]$ trace com.example.service.userservice findallusers --condition 'duration>5000'

# 4. 查看线程堆栈(定位阻塞点)
[arthas@12345]$ thread -n 3  # 显示 cpu 最高 3 个线程
[arthas@12345]$ thread 25   # 查看线程 id 25 的完整堆栈
java 线程池与数据库连接池调优(spring boot)
# application.yml
spring:
  datasource:
    hikari:
      # ✅ 关键:连接池大小必须匹配数据库最大连接数
      maximum-pool-size: 20
      minimum-idle: 5
      # ✅ 关键:连接超时必须 < nginx proxy_read_timeout
      connection-timeout: 30000  # 30s
      validation-timeout: 3000
      idle-timeout: 600000
      max-lifetime: 1800000
  # ✅ 关键:webmvc 线程池(tomcat/jetty)
  web:
    server:
      tomcat:
        threads:
          max: 200          # tomcat 最大工作线程
          min-spare: 10     # 最小空闲线程
  # ✅ 关键:异步任务线程池(@async)
  task:
    execution:
      pool:
        core-size: 10
        max-size: 50
        queue-capacity: 100
nginx 超时配置黄金公式
upstream java_backend {
    server 10.0.1.5:8080;
    server 10.0.1.6:8080;

    # ✅ 黄金公式:proxy_read_timeout ≥ (db连接超时 + 业务逻辑p99 + gc停顿p99)
    #    假设 db 超时 30s,业务 p99 15s,gc p99 2s → 至少 47s,建议设为 60s
    proxy_read_timeout 60s;
    proxy_send_timeout 60s;
    proxy_connect_timeout 5s; # 网络层握手,通常 1-3s 足够

    # ✅ 关键:启用 keepalive,复用连接,避免反复握手耗时
    keepalive 32;
}

server {
    location /api/ {
        proxy_pass http://java_backend;
        proxy_http_version 1.1;
        proxy_set_header connection '';
        # ✅ 关键:透传真实客户端 ip,用于后端日志追踪
        proxy_set_header x-real-ip $remote_addr;
        proxy_set_header x-forwarded-for $proxy_add_x_forwarded_for;
        proxy_set_header x-forwarded-proto $scheme;
    }
}
java 接口级超时控制(防御性编程)
@service
public class reportservice {
    private final resttemplate resttemplate;
    public reportservice(resttemplatebuilder builder) {
        // ✅ 为 resttemplate 设置独立超时,避免拖垮整个应用
        this.resttemplate = builder
                .setconnecttimeout(duration.ofseconds(5))   // 连接超时
                .setreadtimeout(duration.ofseconds(30))     // 读取超时(必须 < nginx proxy_read_timeout)
                .build();
    }
    public report generatereport(reportrequest request) {
        try {
            // ✅ 使用 completablefuture 实现异步调用 + 超时控制
            return completablefuture.supplyasync(() -> {
                try {
                    // 调用外部报表服务
                    return resttemplate.postforobject(
                            "https://report-service/v1/generate",
                            request,
                            report.class);
                } catch (resourceaccessexception ex) {
                    throw new reportgenerationexception("external report service unavailable", ex);
                }
            }, executors.newfixedthreadpool(5))
            .ortimeout(45, timeunit.seconds) // ✅ 整体超时 45s < nginx 60s
            .exceptionally(throwable -> {
                if (throwable instanceof timeoutexception) {
                    throw new reportgenerationexception("report generation timeout after 45s");
                }
                throw new runtimeexception(throwable);
            })
            .join();
        } catch (completionexception e) {
            throw new reportgenerationexception("failed to generate report", e.getcause());
        }
    }
}
mermaid:504 超时传递链路(nginx ↔ java)
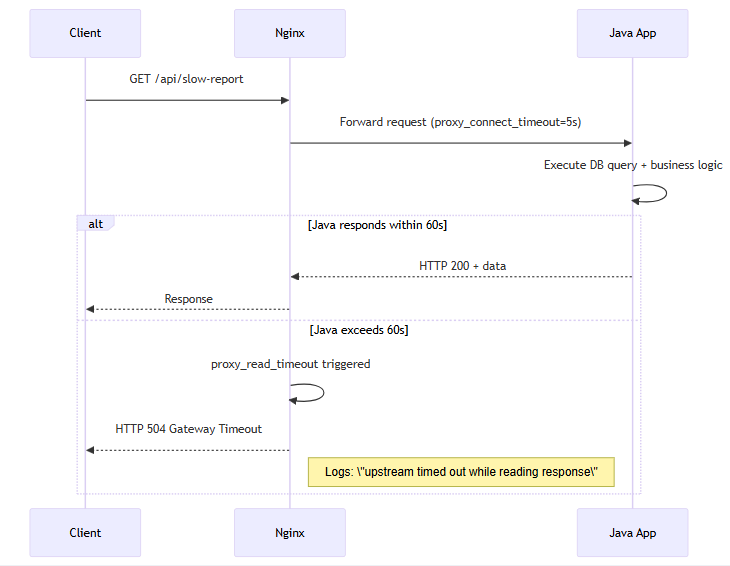
性能基线建议:生产环境所有接口 p99 必须 < 3s,复杂报表类接口 p99 < 30s。若无法达标,必须拆分为异步任务(websocket 或消息队列通知结果)。
六、综合故障演练:一个真实的 502→503→504 连锁反应
故障场景还原
某日午间,监控告警突增:
502 bad gateway率从 0% 升至 12%- 5 分钟后,
503 service unavailable升至 100% - 最终
504 gateway timeout占比 85%
排查时间线与决策树
| 时间 | 现象 | 诊断动作 | 结论 |
|---|---|---|---|
| t+0min | 502 突增 | tail -f /var/log/nginx/error.log | grep "502" | 发现大量 upstream prematurely closed connection |
| t+2min | 502 转 503 | curl -i http://10.0.1.5:8080/actuator/health | 返回 {"status":"down","details":{"db":{"status":"down"}}} |
| t+3min | 503 持续 | kubectl get pods -n prod | grep java-app | 发现 pod 处于 crashloopbackoff 状态 |
| t+4min | 查看 pod 日志 | kubectl logs java-app-7b8cd9d4f5-abcde --previous | 发现 java.lang.outofmemoryerror: gc overhead limit exceeded |
| t+5min | 检查 jvm 参数 | kubectl exec java-app-7b8cd9d4f5-abcde -- ps aux | grep java | 发现 -xmx2g 但容器内存限制为 1.5gi → oom kill |
根本原因:内存配置错配引发的雪崩
- java 容器内存限制
1.5gi,但 jvm 堆上限-xmx2g→ jvm 申请内存超过容器限额 → linux oom killer 杀死 java 进程 - 进程重启中,
/actuator/health返回down→ nginx 主动摘除该节点 → 剩余节点流量倍增 → 更快 oom → 全部节点下线 → 503 - 部分请求在进程崩溃前已进入处理队列,但因 gc 停顿过长(stw),nginx
proxy_read_timeout触发 → 504
java 容器化内存安全配置(docker/k8s)
# dockerfile
from openjdk:17-jdk-slim

# ✅ 关键:使用 jvm 容器感知参数(jdk 10+ 原生支持)
#      -xx:+usecontainersupport 自动识别容器内存限制
#      -xx:maxrampercentage=75.0 将最大堆设为容器内存的 75%
env java_opts="-xx:+usecontainersupport -xx:maxrampercentage=75.0 -xx:+useg1gc"

copy app.jar /app.jar
entrypoint ["sh", "-c", "java $java_opts -jar /app.jar"]
# kubernetes deployment.yaml
apiversion: apps/v1
kind: deployment
metadata:
  name: java-app
spec:
  template:
    spec:
      containers:
      - name: app
        image: my-java-app:1.0
        resources:
          requests:
            memory: "1536mi"   # ✅ 必须 ≥ jvm maxrampercentage 计算出的堆上限
            cpu: "500m"
          limits:
            memory: "2gi"       # ✅ 容器内存上限,jvm 以此为基准
            cpu: "1000m"
        env:
        - name: java_opts
          value: "-xx:+usecontainersupport -xx:maxrampercentage=75.0 -xx:+useg1gc"
验证命令:进入容器执行 java -xx:+printflagsfinal -version \| grep -e "maxheapsize|maxrampercentage",确认 maxheapsize ≈ 2gi * 0.75 = 1.5gi
七、终极防护:构建 nginx + java 的可观测性闭环
零信任时代,不能只靠故障后排查。必须建设前置预警、实时监控、自动处置三位一体的防护网。
关键监控指标(prometheus + grafana)
| 指标 | prometheus 查询 | 告警阈值 | 说明 |
|---|---|---|---|
nginx_upstream_requests_total{code=~"50[234]"}[5m] | sum(rate(nginx_upstream_requests_total{code=~"50[234]"}[5m])) by (code) | > 10 req/sec | 5xx 率突增 |
nginx_upstream_response_time_seconds_bucket{le="60"} | histogram_quantile(0.99, rate(nginx_upstream_response_time_seconds_bucket[1h])) | > 60s | p99 响应超时 |
process_resident_memory_bytes{app="java-app"} | process_resident_memory_bytes{app="java-app"} / (2 * 1024 * 1024 * 1024) | > 0.95 | java 进程内存使用率 >95% |
jvm_gc_pause_seconds_count{action="endofmajorgc"} | rate(jvm_gc_pause_seconds_count{action="endofmajorgc"}[5m]) | > 5 | 每分钟 full gc 次数 >5 |
java 应用自愈脚本(当 gc 频繁时自动重启)
@component
public class gcwatcher {
    private static final logger log = loggerfactory.getlogger(gcwatcher.class);
    @eventlistener
    public void handlegcevent(garbagecollectionevent event) {
        if ("g1 old generation".equals(event.getgarbagecollectorname()) &&
                event.getduration() > 2000 && // gc 耗时 >2s
                system.currenttimemillis() - event.getstarttime() < 60_000) { // 近 1 分钟内
            long gccount = managementfactory.getgarbagecollectormxbean(
                    "g1 old generation").getcollectioncount();
            // ✅ 连续 3 次长时间 gc,触发自愈
            if (gccount >= 3) {
                log.error("critical: 3+ long gc detected in 60s. triggering graceful shutdown.");
                runtime.getruntime().addshutdownhook(new thread(() -> {
                    try {
                        // 等待正在处理的请求完成(spring boot actuator 提供)
                        thread.sleep(30_000);
                    } catch (interruptedexception e) {
                        thread.currentthread().interrupt();
                    }
                }));
                system.exit(143); // sigterm
            }
        }
    }
}
nginx 自动扩容 hook(配合 k8s hpa)
# 在 nginx 配置中注入指标
log_format metrics '$remote_addr - $remote_user [$time_local] '
                    '"$request" $status $body_bytes_sent '
                    '$request_time $upstream_response_time '
                    '$upstream_addr $upstream_status';

# 通过 logstash 或 filebeat 将 metrics 日志发送至 elasticsearch
# kibana 中创建告警:当 5xx 率 >5% 且持续 2 分钟 → 触发 k8s api 扩容
八、结语:把“网关错误”变成“系统免疫力”
502、503、504 从来不是孤立的错误代码,它们是分布式系统在压力、故障、配置偏差下发出的健康脉搏。每一次 502 都在提醒我们:“上游的协议契约是否被严格遵守?”;每一次 503 都在叩问:“我们的服务拓扑是否具备弹性?”;每一次 504 都在警示:“时间预算是否被理性分配?”
真正的稳定性,不在于消灭所有错误,而在于让错误变得可预测、可测量、可收敛。当 nginx 的 error.log 不再是惊慌失措的源头,而成为你信任的诊断仪表盘;当 java 应用的 actuator/health 不再是摆设,而是你心中有数的健康证明;当 proxy_read_timeout 的数值背后,是你对数据库、缓存、网络每一毫秒的深刻理解——那一刻,你已将网关错误,淬炼成了系统的免疫力。
以上就是nginx中生产环境常见错误502、503、504的排查与解决的详细内容,更多关于nginx生产环境错误排查与解决的资料请关注代码网其它相关文章!



发表评论