在 mysql 5.7 及以上版本中,performance_schema(简称 p_s) 是官方推荐的、用于替代 show profiles 的低开销性能监控机制。
它默认开启(无需手动启用),通过一系列系统表实时收集 sql 执行、锁等待、i/o、内存等详细性能数据。
一、performance_schema是什么
performance_schema 是一个「数据库」(database / schema)
在 mysql 中,performance_schema 是 内置的系统数据库之一,和以下这些是同一类:
- mysql:存储用户、权限等元数据
- information_schema:提供元数据视图(如表结构、列信息)
- sys:基于 performance_schema 的简化视图(mysql 5.7+)
- performance_schema:提供底层性能监控数据
你可以用以下命令验证:
输出
编辑
+--------------------+
| database |
+--------------------+
| information_schema |
| mysql |
| performance_schema | ← 看!它是一个数据库!
| sys |
| your_app_db |
+--------------------+
它里面有很多「表」,但这些表是「内存中的虚拟表」
进入 performance_schema 数据库后,你可以看到很多表:
use performance_schema;
show tables;
你会看到上百张表,例如:
- events_statements_current
- events_statements_history
- events_statements_summary_by_digest
- events_waits_history
- file_summary_by_instance
- ...
⚠️ 注意:这些表 不是磁盘上的真实文件,而是 mysql 内存中动态生成的“视图”或“接口”,用于暴露内部性能数据。
- 它们 没有 .frm 或 .ibd 文件
- 你不能
insert、update、delete(只读) - 查询它们时,mysql 会实时从内存结构中收集数据返回
所以,performance_schema 是一个特殊的只读系统数据库,它的“表”其实是性能监控的 api 接口。
二、高效性能分析
下面以 “监控最近执行的慢查询及其耗时” 为例,手把手教你如何使用 performance_schema 进行高效性能分析。
第一步:确认performance_schema已启用
show variables like 'performance_schema';
- 如果返回
on→ 正常可用(mysql 5.7+ 默认开启) - 如果是
off→ 需在my.cnf中添加performance_schema=on并重启 mysql
第二步:查看最近执行的 sql 语句(类似show profiles)
关键表:events_statements_history
它记录了每个连接最近执行的若干条 sql(数量由 performance_schema_events_statements_history_size 控制,默认 10 条/连接)。
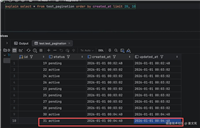
查看所有最近执行的语句(含耗时):
select
  thread_id,
  event_id,
  sql_text,
  timer_wait / 1000000000000 as exec_time_sec  -- 转换为秒
from performance_schema.events_statements_history
where sql_text is not null
order by event_id desc
limit 10;
输出示例:
thread_id | event_id | sql_text | exec_time_sec
45 | 12345 | select * from users where id=1 | 0.0023
timer_wait 单位是皮秒(picoseconds),除以 10^12 得到秒。
第三步:查看某条 sql 的详细阶段耗时(类似show profile)
关键表:events_stages_history
记录每条 sql 在各个执行阶段(如解析、优化、执行、发送结果等)的耗时。
步骤:
- 先从
events_statements_history中找到目标event_id - 用该
event_id查询对应的阶段信息:
-- 假设上一步查到 event_id = 12345
select
  event_name as stage,
  timer_wait / 1000000000000 as duration_sec
from performance_schema.events_stages_history
where nesting_event_id = 12345
order by timer_start;
输出示例:
stage | duration_sec
stage/sql/opening tables | 0.0001
stage/sql/system lock | 0.00002
stage/sql/optimizing | 0.0003
stage/sql/executing | 0.0015
这就相当于 show profile for query ... 的效果,但更结构化!
第四步:监控“慢查询”(自动捕获耗时长的 sql)
方法:使用events_statements_summary_by_digest
这个表会自动聚合相同模式的 sql(如 select * from t where id=?),并统计平均耗时、最大耗时、执行次数等。
select
  digest_text as normalized_sql,     -- 参数化后的sql模板
  count_star as exec_count,
  avg_timer_wait / 1000000000000 as avg_time_sec,
  max_timer_wait / 1000000000000 as max_time_sec,
  sum_rows_examined / count_star as avg_rows_examined
from performance_schema.events_statements_summary_by_digest
where digest_text is not null
order by avg_time_sec desc
limit 10;
这是 最实用的性能分析入口!可以快速发现:
- 哪些 sql 平均耗时最长?
- 哪些 sql 扫描行数最多?
- 哪些 sql 执行频率最高?
第五步:实时监控当前正在执行的 sql
使用events_statements_current
select
  processlist_id as conn_id,
  sql_text,
  timer_wait / 1000000000000 as running_time_sec
from performance_schema.events_statements_current
where sql_text is not null;
结合 show processlist,可定位卡住的查询。
三、实用技巧 & 注意事项
1. 清空历史统计(重置计数器)
truncate table performance_schema.events_statements_summary_by_digest;
2. 开启更多监控项(默认已开启大部分)
检查是否启用 statement 监控:
select * from performance_schema.setup_consumers
where name like '%statement%';
-- 确保 events_statements_current/history/summary 都是 enabled
3. 性能开销极低
performance_schema使用环形缓冲区内存,不写磁盘- 开销通常 < 5%,远低于
profiling=on
4. 与慢查询日志互补
slow_query_log:记录超过阈值的 sql(适合长期归档)performance_schema:实时分析所有 sql(适合开发调试)
四、总结:如何替代show profiles
| 旧方式 (show profiles) | 新方式 (performance_schema) |
|---|---|
| show profiles; | select * from events_statements_history; |
| show profile for query n; | select * from events_stages_history where nesting_event_id=n; |
| 手动开启 set profiling=1; | 默认开启,无需配置 |
| 仅当前会话有效 | 全局监控,支持多会话 |
| 已废弃(mysql 8.0 移除) | 官方推荐,功能更强大 |
五、推荐日常使用命令
-- 1. 查看最近10条sql及耗时
select
    sql_text, timer_wait/1e12 as sec
from
    performance_schema.events_statements_history
order by
    event_id
desc limit 10;

-- 2. 查找最慢的sql模板
select
    digest_text, avg_timer_wait/1e12 as avg_sec
from
    performance_schema.events_statements_summary_by_digest
order by
    avg_sec
desc limit 5;
通过 performance_schema,你不仅能获得比 show profiles 更丰富的信息,还能实现自动化监控、告警和根因分析,是现代 mysql 性能调优的必备技能。
到此这篇关于mysql使用 performance_schema 进行性能监控的文章就介绍到这了,更多相关mysql使用performance_schema进行性能监控内容请搜索代码网以前的文章或继续浏览下面的相关文章希望大家以后多多支持代码网!


发表评论