1、获取服务器使用信息
show status
语法规则
show [session | global] status like 'connections'
这里的 [session | global]可以省略不写,默认为session,这个参数表示获取性能参数的级别,session表示当前会话级别,global表示获取全局级别。
| 参数值 | 参数说明 |
|---|---|
| connections | 连接mysql服务器的次数 |
| uptime | mysql服务器启动后连续工作的时间 |
| slow_queries | 慢查询的次数 |
| com_insert | 插入数据的次数(只统计insert语句的次数,一次插入多条算一次) |
| com_delete | 删除数据的次数 |
| com_update | 修改数据的次数 |
| com_select | 查询数据的次数 |
| innodb_rows_read | 查询数据时返回的数据行数 |
| innodb_rows_inserted | 插入数据时返回的记录数 |
| innodb_rows_updated | 更新数据时返回的记录数 |
| innodb_rows_delete | 删除数据时返回的记录数 |
例如查看myslq服务器启动后连续工作的时间
mysql> show session status like 'connections';
+---------------+-------+
| variable_name | value |
+---------------+-------+
| connections   | 10    |
+---------------+-------+
1 row in set (0.00 sec)

mysql> show global status like 'connections';
+---------------+-------+
| variable_name | value |
+---------------+-------+
| connections   | 10    |
+---------------+-------+
1 row in set (0.01 sec)

mysql> show status like 'connections';
+---------------+-------+
| variable_name | value |
+---------------+-------+
| connections   | 10    |
+---------------+-------+
1 row in set (0.00 sec)
2、分析查询语句
explain
语法格式
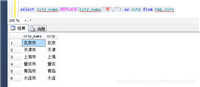
explain select id,name,age from student \g;
只需要在查询语句之前添加explain语句即可,这时这个语句不会真的查询数据,而是根据explain模拟优化器执行slq语句,并输出相关信息。例如
mysql> explain select name from student \g;
*************************** 1. row ***************************
           id: 1
  select_type: simple
        table: student
   partitions: null
         type: all
possible_keys: null
          key: null
      key_len: null
          ref: null
         rows: 1000
     filtered: 100.00
        extra: null
1 row in set, 1 warning (0.00 sec)
(1)id:表示select语句的序列号,有多少个select语句就有多少个序列号。
(2)select_type:sql语句的查询类型,简单查询语句/复杂查询语句。
| 类型 | 说明 |
|---|---|
| simple | 简单查询 |
| primary | 主键查询或者包含子查询时最外层的查询语句 |
| union | 连接查询,表示连接查询的第二个语句或者更后面 |
| dependent union | 与union差不多,但是这里取决于最外层的查询语句 |
| union result | 连接查询的结果信息 |
| subquery | 子查询中的第一个查询语句 |
| dependent subquery | 取决于外层的查询语句 |
| derived | from子句中的子查询 |
| materialized | 表示实例化子查询 |
| uncacheable subquery | 不缓存子查询的结果数据,重新计算外部查询的每一行数据 |
| uncacheable union | 不缓存连接查询的结果数据,每次执行连接查询时都会重新计算数据结果 |
(3)table:当前查询的数据表
(4)partitions:如果这个是分区表、表示查询结果匹配的分区。负责返回null。
(5)type:当前sql语句使用的关联类型或者访问类型。最优到差依次为
system>const>eq_ref>ref>fulltext>ref_or_null>index_merge>unique_subquery>index_subquery>range>index>all
(6)possible_keys:执行查询语句时可能使用到的索引。但在实际查询中未必会使用到。为null时表示没有可使用的索引。
(7)key:执行查询语句时实际会使用到的索引,没有使用则为null。
(8)key_len:实际使用到索引按照字节计算的长度值。
(9)ref:数据表中的哪个列或者常量用来与key列中的索引做比较来检索数据。
(10)rows:查询数据的行数。
(11)filtered:查询结果符合查询条件的百分比。
(12)ectra:执行查询语句时额外的详细信息。
3、深入分析
show profile语句解析
查看mysql是否支持profile
mysql> select @@have_profiling;
+------------------+
| @@have_profiling |
+------------------+
| yes              |
+------------------+
1 row in set, 1 warning (0.00 sec)
默认profiling时关闭的
mysql> select @@profiling;
+-------------+
| @@profiling |
+-------------+
|           0 |
+-------------+
1 row in set, 1 warning (0.00 sec)
通过set语句开启
mysql> set session profiling=1;
query ok, 0 rows affected, 1 warning (0.01 sec)
mysql> select @@profiling;
+-------------+
| @@profiling |
+-------------+
|           1 |
+-------------+
1 row in set, 1 warning (0.00 sec)
3.1、分析innodb数据表
- 查看表结构
mysql> show create table student \g;
*************************** 1. row ***************************
       table: student
create table: create table `student` (
  `name` varchar(255) default null,
  `age` int default null,
  `gender` varchar(255) default null,
  `school` varchar(255) default null,
  `id` int not null auto_increment,
  `phone` varchar(255) default null,
  primary key (`id`)
) engine=innodb auto_increment=1001 default charset=utf8mb4 collate=utf8mb4_0900_ai_ci
1 row in set (0.00 sec)
- 查看数据条数
mysql> select count(*) from student;
+----------+
| count(*) |
+----------+
|     1000 |
+----------+
1 row in set (0.00 sec)
- 查看sql语句信息
mysql> show profiles;
+----------+------------+--------------------------------+
| query_id | duration   | query                          |
+----------+------------+--------------------------------+
|        1 | 0.00342200 | select @@profiling             |
|        2 | 0.00027400 | select countct(*) from student |
|        3 | 0.00028900 | select countct(*) from student |
|        4 | 0.00436800 | select count(*) from student   |
|        5 | 0.00045100 | show create tables student     |
|        6 | 0.00571900 | show create table student      |
|        7 | 0.00136000 | show create table student      |
|        8 | 0.00401200 | select count(*) from student   |
|        9 | 0.00037000 | show profiles
;               |
+----------+------------+--------------------------------+
9 rows in set, 1 warning (0.00 sec)
- 查询执行sql语句执行过程中的所在线程的具体信息
mysql> show profile for query 8;
+--------------------------------+----------+
| status                         | duration |
+--------------------------------+----------+
| starting                       | 0.001623 |
| executing hook on transaction  | 0.000015 |
| starting                       | 0.000029 |
| checking permissions           | 0.000017 |
| opening tables                 | 0.000119 |
| init                           | 0.000013 |
| system lock                    | 0.000025 |
| optimizing                     | 0.000014 |
| statistics                     | 0.000060 |
| preparing                      | 0.000051 |
| executing                      | 0.001900 |
| end                            | 0.000008 |
| query end                      | 0.000007 |
| waiting for handler commit     | 0.000030 |
| closing tables                 | 0.000019 |
| freeing items                  | 0.000062 |
| cleaning up                    | 0.000020 |
+--------------------------------+----------+
17 rows in set, 1 warning (0.00 sec)
可以看到这条sql语句的主要时间花在了executing和starting
- 查看指定sql语句消耗的block io资源
mysql> show profile block io for query 8;
+--------------------------------+----------+--------------+---------------+
| status                         | duration | block_ops_in | block_ops_out |
+--------------------------------+----------+--------------+---------------+
| starting                       | 0.001623 |            0 |             0 |
| executing hook on transaction  | 0.000015 |            0 |             0 |
| starting                       | 0.000029 |            0 |             0 |
| checking permissions           | 0.000017 |            0 |             0 |
| opening tables                 | 0.000119 |            0 |             0 |
| init                           | 0.000013 |            0 |             0 |
| system lock                    | 0.000025 |            0 |             0 |
| optimizing                     | 0.000014 |            0 |             0 |
| statistics                     | 0.000060 |            0 |             0 |
| preparing                      | 0.000051 |            0 |             0 |
| executing                      | 0.001900 |            0 |             0 |
| end                            | 0.000008 |            0 |             0 |
| query end                      | 0.000007 |            0 |             0 |
| waiting for handler commit     | 0.000030 |            0 |             0 |
| closing tables                 | 0.000019 |            0 |             0 |
| freeing items                  | 0.000062 |            0 |             0 |
| cleaning up                    | 0.000020 |            0 |             0 |
+--------------------------------+----------+--------------+---------------+
17 rows in set, 1 warning (0.00 sec)
这条sql语句没有消耗资源。也就是没有io操作。


发表评论