刚开始用python操作mysql时,你是不是也这样:程序突然变慢,数据库连接莫名断开,线上出了bug却找不到原因,只能对着日志文件“盲人摸象”?我当年接手第一个python web项目时,就因为没配监控,半夜被报警电话叫醒,花了3小时才定位到一个简单的慢查询。今天,我就带你用30分钟,从零搭建一套生产级的mysql监控与日志体系,让你对数据库状态“明察秋毫”。
一、 为什么我们需要监控与日志
去年我负责一个用户中心的python项目,用的是flask + mysql架构。上线初期一切正常,直到某个周末,用户反馈页面加载要十几秒。我们查了应用日志、服务器负载,都没问题。最后,还是一个有经验的dba提醒:“看看mysql的慢查询日志吧。”
结果一查,发现一条原本0.1秒的查询,因为缺少索引,在数据量增长后变成了15秒的“巨兽”。没有监控,我们就像在黑暗中开车,直到撞墙才知道路有问题。
对于python开发者来说,mysql监控与日志配置能帮你解决三大痛点:
- 性能瓶颈定位:快速找到拖慢系统的sql语句
- 故障预警与排查:连接异常、死锁发生时能及时知道原因
- 容量规划与优化:了解数据库负载趋势,为扩容提供数据支撑
接下来,我会手把手带你配置三个核心部分:慢查询日志、性能监控(performance schema)和python端的连接健康检查。
二、 环境准备:搭建你的实验战场
在开始实战前,我们需要准备好“战场”。这里我假设你已经有了python和mysql的基础环境。
2.1 检查与安装mysql(以ubuntu为例)
# 检查mysql是否安装
mysql --version

# 如果未安装,使用apt安装(其他系统请参考官方文档)
sudo apt update
sudo apt install mysql-server mysql-client

# 启动mysql服务
sudo systemctl start mysql
sudo systemctl enable mysql

# 安全初始化(设置root密码等)
sudo mysql_secure_installation
2.2 安装python mysql驱动
我们将使用最流行的pymysql驱动,它纯python实现,兼容性好。
# 创建虚拟环境(推荐)
python -m venv mysql-monitor-env
source mysql-monitor-env/bin/activate  # linux/mac
# 或 mysql-monitor-env\scripts\activate  # windows

# 安装pymysql
pip install pymysql

# 安装额外的工具库,用于后续的监控数据可视化
pip install matplotlib pandas
2.3 创建测试数据库和数据
让我们创建一个真实的业务场景——电商用户订单系统。
# create_test_data.py
import pymysql
import random
from datetime import datetime, timedelta

def create_test_database():
    """创建测试数据库和表,并插入模拟数据"""

    # 连接mysql(请替换为你的实际密码)
    connection = pymysql.connect(
        host='localhost',
        user='root',
        password='your_password',  # 改成你的mysql root密码
        charset='utf8mb4',
        cursorclass=pymysql.cursors.dictcursor
    )

    try:
        with connection.cursor() as cursor:
            # 创建数据库
            cursor.execute("create database if not exists ecommerce_monitor")
            cursor.execute("use ecommerce_monitor")

            # 创建用户表
            cursor.execute("""
                create table if not exists users (
                    id int auto_increment primary key,
                    username varchar(50) not null unique,
                    email varchar(100) not null,
                    created_at timestamp default current_timestamp,
                    index idx_username (username),
                    index idx_created_at (created_at)
                )
            """)

            # 创建订单表(故意不加索引,用于演示慢查询)
            cursor.execute("""
                create table if not exists orders (
                    id int auto_increment primary key,
                    user_id int not null,
                    amount decimal(10, 2) not null,
                    status enum('pending', 'paid', 'shipped', 'delivered') default 'pending',
                    created_at timestamp default current_timestamp,
                    foreign key (user_id) references users(id)
                    # 注意:这里故意不在user_id和created_at上加索引!
                )
            """)

            # 插入测试用户数据
            print("插入用户数据...")
            users = []
            for i in range(1, 1001):  # 1000个用户
                users.append((f'user{i}', f'user{i}@example.com'))

            cursor.executemany(
                "insert into users (username, email) values (%s, %s)",
                users
            )

            # 插入测试订单数据(更多数据,用于模拟真实场景)
            print("插入订单数据...")
            orders = []
            start_date = datetime.now() - timedelta(days=365)

            for i in range(1, 50001):  # 5万条订单
                user_id = random.randint(1, 1000)
                amount = round(random.uniform(10.0, 1000.0), 2)
                days_ago = random.randint(0, 365)
                order_date = start_date + timedelta(days=days_ago)

                # 随机状态
                status = random.choice(['pending', 'paid', 'shipped', 'delivered'])

                orders.append((
                    user_id,
                    amount,
                    status,
                    order_date.strftime('%y-%m-%d %h:%m:%s')
                ))

            # 分批插入,避免单次sql太大
            batch_size = 1000
            for i in range(0, len(orders), batch_size):
                batch = orders[i:i+batch_size]
                cursor.executemany(
                    """insert into orders (user_id, amount, status, created_at)
                       values (%s, %s, %s, %s)""",
                    batch
                )
                connection.commit()
                print(f"已插入 {min(i+batch_size, len(orders))}/{len(orders)} 条订单")

            print("测试数据创建完成!")

    finally:
        connection.close()

if __name__ == "__main__":
create_test_database()运行这个脚本前,记得把password='your_password'改成你的mysql root密码。这个脚本会创建5万条订单数据,足够我们演示监控效果了。
三、 核心概念:mysql监控的“三驾马车”
在深入配置前,我们先理解三个核心概念,这就像医生看病需要了解体温、血压、心率一样。
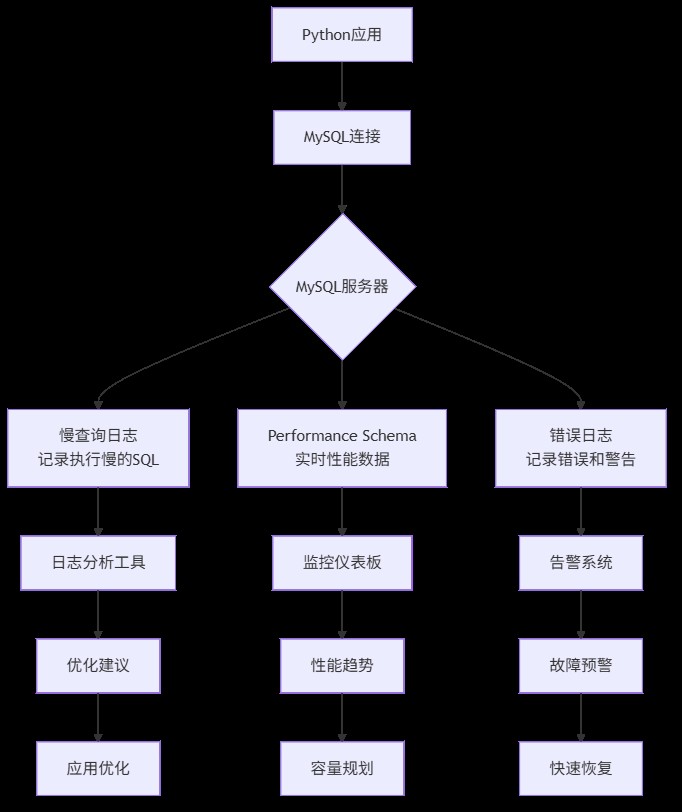
1. 慢查询日志(slow query log)
- 是什么:记录执行时间超过指定阈值的sql语句
- 为什么重要:80%的性能问题由20%的慢查询引起。找到它们,就找到了优化关键点
- 怎么用:通过mysql配置开启,设置时间阈值(如2秒)
2. performance schema
- 是什么:mysql 5.5+引入的性能监控框架,像数据库的"仪表盘"
- 为什么重要:提供实时、低开销的性能数据,包括连接数、锁等待、sql执行统计等
- 怎么用:默认启用,通过sql查询各种性能表
3. 错误日志(error log)
- 是什么:记录mysql启动、运行、停止过程中的错误和警告信息
- 为什么重要:故障排查的第一现场,连接失败、崩溃原因都在这里
- 怎么用:mysql自动记录,只需知道查看位置
四、 实战演练:配置你的第一套监控系统
4.1 配置慢查询日志——找到拖慢系统的"罪魁祸首"
慢查询日志是优化数据库的第一步。让我们配置并分析它。
步骤1:修改mysql配置
# 编辑mysql配置文件
sudo nano /etc/mysql/mysql.conf.d/mysqld.cnf  # ubuntu路径,其他系统可能不同

# 在[mysqld]部分添加或修改以下配置:
"""
[mysqld]
# 开启慢查询日志
slow_query_log = 1

# 指定慢查询日志文件路径
slow_query_log_file = /var/log/mysql/mysql-slow.log

# 设置慢查询阈值(单位:秒),这里设为1秒,生产环境通常设2-3秒
long_query_time = 1

# 记录未使用索引的查询(即使执行时间没超过阈值)
log_queries_not_using_indexes = 1

# 每分钟最多记录多少条慢查询,避免日志爆炸
log_throttle_queries_not_using_indexes = 10
"""

# 保存后重启mysql
sudo systemctl restart mysql
步骤2:验证配置并生成慢查询
# generate_slow_queries.py
import pymysql
import time

def generate_slow_queries():
    """执行一些会触发慢查询的sql"""

    connection = pymysql.connect(
        host='localhost',
        user='root',
        password='your_password',
        database='ecommerce_monitor',
        charset='utf8mb4',
        cursorclass=pymysql.cursors.dictcursor
    )

    try:
        with connection.cursor() as cursor:
            print("执行可能较慢的查询...")

            # 查询1:全表扫描(orders表没有user_id索引)
            start = time.time()
            cursor.execute("""
                select * from orders
                where user_id = 500
                and created_at > '2023-01-01'
                order by created_at desc
            """)
            result1 = cursor.fetchall()
            elapsed1 = time.time() - start
            print(f"查询1(无索引条件查询)耗时: {elapsed1:.3f}秒,返回 {len(result1)} 条记录")

            # 查询2:复杂联表查询
            start = time.time()
            cursor.execute("""
                select u.username, count(o.id) as order_count, sum(o.amount) as total_amount
                from users u
                left join orders o on u.id = o.user_id
                where o.created_at > '2023-06-01'
                group by u.id
                having order_count > 5
                order by total_amount desc
                limit 20
            """)
            result2 = cursor.fetchall()
            elapsed2 = time.time() - start
            print(f"查询2(复杂联表分组)耗时: {elapsed2:.3f}秒")

            # 查询3:使用索引的快速查询(作为对比)
            start = time.time()
            cursor.execute("select * from users where username = 'user500'")
            result3 = cursor.fetchall()
            elapsed3 = time.time() - start
            print(f"查询3(使用索引查询)耗时: {elapsed3:.3f}秒")

    finally:
        connection.close()

if __name__ == "__main__":
generate_slow_queries()运行这个脚本,你会看到前两个查询明显较慢(特别是第一个,因为orders表的user_id和created_at字段没有索引)。
步骤3:分析慢查询日志
# 查看慢查询日志(需要sudo权限)
sudo tail -100 /var/log/mysql/mysql-slow.log

# 使用mysqldumpslow工具分析(mysql自带)
sudo mysqldumpslow /var/log/mysql/mysql-slow.log -t 10 -s at

# 输出示例:
"""
count: 3  time=1.23s (3s)  lock=0.00s (0s)  rows=152.7 (458), root[root]@localhost
  select * from orders where user_id = n and created_at > 's' order by created_at desc
"""
这个输出告诉我们:同一种模式的查询执行了3次,平均耗时1.23秒,每次返回约153行数据。问题很明显:需要在orders.user_id和orders.created_at上建立索引。
步骤4:根据分析结果优化
# add_indexes.py
import pymysql

def add_necessary_indexes():
    """根据慢查询分析添加缺失的索引"""

    connection = pymysql.connect(
        host='localhost',
        user='root',
        password='your_password',
        database='ecommerce_monitor',
        charset='utf8mb4'
    )

    try:
        with connection.cursor() as cursor:
            print("添加缺失的索引...")

            # 为orders表的user_id添加索引
            cursor.execute("""
                alter table orders
                add index idx_user_id (user_id),
                add index idx_created_at (created_at),
                add index idx_user_created (user_id, created_at)
            """)

            print("索引添加完成!")

            # 验证优化效果
            print("\n验证优化效果:")
            cursor.execute("explain select * from orders where user_id = 500 and created_at > '2023-01-01'")
            explain_result = cursor.fetchone()

            print(f"查询执行计划:")
            print(f"- 使用的索引: {explain_result.get('key', '无')}")
            print(f"- 扫描行数: {explain_result.get('rows', '未知')}")
            print(f"- 查询类型: {explain_result.get('type', '未知')}")

    finally:
        connection.close()

if __name__ == "__main__":
add_necessary_indexes()运行后再执行之前的慢查询脚本,你会发现第一个查询从秒级变成了毫秒级!这就是监控的价值:数据驱动优化。
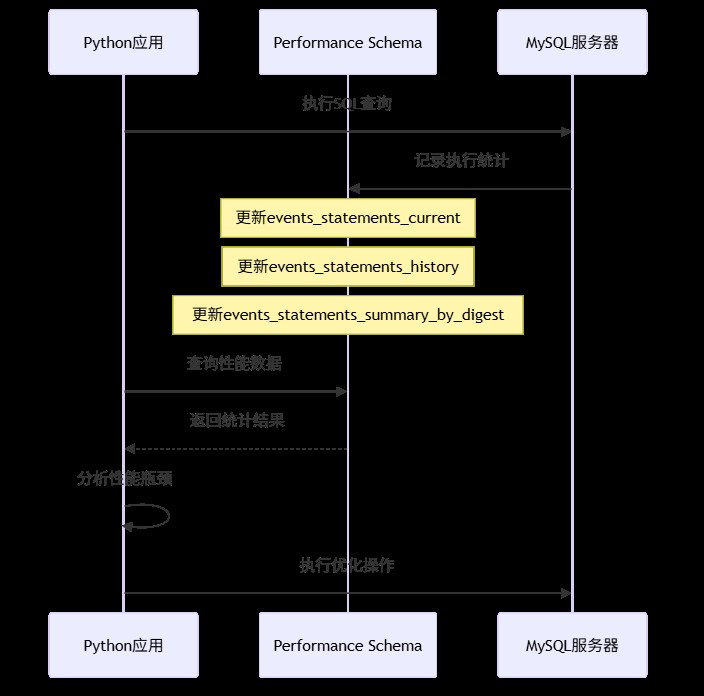
4.2 使用performance schema——数据库的实时"仪表盘"
performance schema(性能模式)是mysql内置的性能监控工具,开销极小,适合生产环境。
实战:用python监控实时性能
# performance_monitor.py
import pymysql
import time
import pandas as pd
from datetime import datetime

class mysqlperformancemonitor:
    """mysql性能监控器"""

    def __init__(self, host='localhost', user='root', password='', database=''):
        self.connection = pymysql.connect(
            host=host,
            user=user,
            password=password,
            database=database,
            charset='utf8mb4',
            cursorclass=pymysql.cursors.dictcursor
        )

    def get_slow_queries_summary(self):
        """获取慢查询摘要统计"""
        with self.connection.cursor() as cursor:
            cursor.execute("""
                select
                    digest_text as query_pattern,
                    count_star as exec_count,
                    avg_timer_wait/1000000000000 as avg_time_sec,
                    max_timer_wait/1000000000000 as max_time_sec,
                    sum_rows_examined as rows_examined_total,
                    sum_rows_sent as rows_sent_total
                from performance_schema.events_statements_summary_by_digest
                where digest_text is not null
                and avg_timer_wait > 1000000000  # 大于1毫秒
                order by avg_time_sec desc
                limit 10
            """)
            return cursor.fetchall()

    def get_connection_stats(self):
        """获取连接统计"""
        with self.connection.cursor() as cursor:
            cursor.execute("""
                select
                    user as user,
                    host as host,
                    count(*) as connection_count,
                    group_concat(command) as commands
                from information_schema.processlist
                where command != 'sleep'
                group by user, host
            """)
            return cursor.fetchall()

    def get_table_access_stats(self, hours=24):
        """获取表访问统计"""
        with self.connection.cursor() as cursor:
            # 注意:这个查询需要开启某些consumer,默认可能没有数据
            cursor.execute("""
                select
                    object_schema as db_name,
                    object_name as table_name,
                    count_read as read_count,
                    count_write as write_count,
                    count_fetch as fetch_count
                from performance_schema.table_io_waits_summary_by_table
                where count_star > 0
                order by count_star desc
                limit 10
            """)
            return cursor.fetchall()

    def monitor_loop(self, interval=60, duration=300):
        """监控循环,定期收集性能数据"""
        print(f"开始性能监控,每{interval}秒采样一次,持续{duration}秒...")

        data_points = []
        start_time = time.time()

        while time.time() - start_time < duration:
            timestamp = datetime.now()

            # 收集各种性能指标
            slow_queries = self.get_slow_queries_summary()
            connections = self.get_connection_stats()

            # 记录数据点
            data_point = {
                'timestamp': timestamp,
                'slow_query_count': len(slow_queries),
                'active_connections': sum(c['connection_count'] for c in connections),
                'top_slow_query_time': slow_queries[0]['avg_time_sec'] if slow_queries else 0
            }

            data_points.append(data_point)
            print(f"[{timestamp}] 慢查询数: {data_point['slow_query_count']}, "
                  f"活跃连接: {data_point['active_connections']}")

            time.sleep(interval)

        # 转换为dataframe便于分析
        df = pd.dataframe(data_points)
        return df

    def close(self):
        self.connection.close()

# 使用示例
if __name__ == "__main__":
    monitor = mysqlperformancemonitor(
        host='localhost',
        user='root',
        password='your_password',
        database='ecommerce_monitor'
    )

    try:
        # 获取一次性的性能快照
        print("=== 当前慢查询top 10 ===")
        slow_queries = monitor.get_slow_queries_summary()
        for i, query in enumerate(slow_queries[:5], 1):
            print(f"{i}. {query['query_pattern'][:80]}...")
            print(f"   平均耗时: {query['avg_time_sec']:.3f}s, 执行次数: {query['exec_count']}")

        print("\n=== 当前连接统计 ===")
        connections = monitor.get_connection_stats()
        for conn in connections:
            print(f"用户: {conn['user']}, 连接数: {conn['connection_count']}")

        # 运行监控循环(生产环境可以改为后台任务)
        # df = monitor.monitor_loop(interval=10, duration=60)
        # print(f"\n监控数据摘要:\n{df.describe()}")

    finally:
        monitor.close()
这个监控器展示了如何从performance schema获取关键指标。在生产环境中,你可以将这些数据发送到prometheus、grafana等监控系统。
4.3 python端的连接健康检查与日志集成
除了监控mysql服务器,我们还需要在python应用层做好健康检查和日志记录。

实战:带健康检查和日志的连接池
# db_connection_pool.py
import pymysql
import logging
import time
from threading import lock
from contextlib import contextmanager
from datetime import datetime, timedelta

# 配置日志
logging.basicconfig(
    level=logging.info,
    format='%(asctime)s - %(name)s - %(levelname)s - %(message)s',
    handlers=[
        logging.filehandler('mysql_operations.log'),
        logging.streamhandler()
    ]
)
logger = logging.getlogger('mysqlmonitor')

class healthyconnectionpool:
    """带健康检查的mysql连接池"""

    def __init__(self, max_connections=10, **kwargs):
        self.max_connections = max_connections
        self.connection_args = kwargs
        self.pool = []
        self.in_use = set()
        self.lock = lock()
        self.last_health_check = datetime.min

        # 初始化连接池
        self._initialize_pool()

        logger.info(f"连接池初始化完成,最大连接数: {max_connections}")

    def _initialize_pool(self):
        """初始化连接池"""
        for _ in range(min(3, self.max_connections)):
            conn = self._create_connection()
            if conn:
                self.pool.append(conn)

    def _create_connection(self):
        """创建新连接"""
        try:
            conn = pymysql.connect(**self.connection_args)

            # 设置连接属性,便于追踪
            with conn.cursor() as cursor:
                cursor.execute("set @python_client_id = %s",
                             (f"pool_conn_{len(self.pool)}",))

            logger.debug(f"创建新数据库连接: {conn.server_version}")
            return conn
        except exception as e:
            logger.error(f"创建数据库连接失败: {e}")
            return none

    def _health_check(self):
        """定期健康检查"""
        now = datetime.now()
        if now - self.last_health_check < timedelta(minutes=5):
            return

        with self.lock:
            healthy_connections = []
            for conn in self.pool:
                try:
                    with conn.cursor() as cursor:
                        cursor.execute("select 1")
                        cursor.fetchone()
                    healthy_connections.append(conn)
                except exception as e:
                    logger.warning(f"连接健康检查失败,关闭异常连接: {e}")
                    try:
                        conn.close()
                    except:
                        pass

            # 补充连接
            while len(healthy_connections) < self.max_connections:
                new_conn = self._create_connection()
                if new_conn:
                    healthy_connections.append(new_conn)
                else:
                    break

            self.pool = healthy_connections
            self.last_health_check = now

            logger.info(f"健康检查完成,活跃连接数: {len(self.pool)}")

    @contextmanager
    def get_connection(self):
        """获取连接(上下文管理器方式)"""
        self._health_check()

        conn = none
        start_time = time.time()

        with self.lock:
            if self.pool:
                conn = self.pool.pop()
            elif len(self.in_use) < self.max_connections:
                conn = self._create_connection()

            if conn:
                self.in_use.add(id(conn))

        if not conn:
            wait_time = time.time() - start_time
            logger.error(f"获取数据库连接超时,等待{wait_time:.2f}秒后仍无可用连接")
            raise exception("数据库连接池耗尽")

        try:
            # 记录连接获取
            logger.debug(f"获取数据库连接,当前使用中: {len(self.in_use)}")

            # 执行查询前的准备
            with conn.cursor() as cursor:
                cursor.execute("set @query_start_time = now(6)")

            yield conn

        except pymysql.error as e:
            # 记录数据库错误
            error_code, error_msg = e.args
            logger.error(f"数据库操作错误 [{error_code}]: {error_msg}")

            # 根据错误类型决定是否关闭连接
            if error_code in (2006, 2013):  # 连接相关错误
                logger.warning("连接异常,将关闭并创建新连接")
                try:
                    conn.close()
                except:
                    pass
                conn = self._create_connection()
            raise

        finally:
            # 记录查询执行时间
            try:
                with conn.cursor() as cursor:
                    cursor.execute("select timestampdiff(microsecond, @query_start_time, now(6)) / 1000000 as exec_time")
                    result = cursor.fetchone()
                    exec_time = result['exec_time'] if result else 0

                    if exec_time > 1.0:  # 超过1秒的记录为慢查询
                        logger.warning(f"慢查询检测: 执行时间 {exec_time:.3f}秒")
            except:
                exec_time = 0

            # 归还连接
            with self.lock:
                if conn and conn.open:
                    self.pool.append(conn)
                if id(conn) in self.in_use:
                    self.in_use.remove(id(conn))

            logger.debug(f"归还数据库连接,执行时间: {exec_time:.3f}秒")

    def close_all(self):
        """关闭所有连接"""
        with self.lock:
            for conn in self.pool:
                try:
                    conn.close()
                except:
                    pass
            self.pool.clear()
            self.in_use.clear()

        logger.info("连接池已关闭所有连接")

# 使用示例
def example_usage():
    """使用带监控的连接池示例"""

    # 创建连接池
    pool = healthyconnectionpool(
        max_connections=5,
        host='localhost',
        user='root',
        password='your_password',
        database='ecommerce_monitor',
        charset='utf8mb4',
        cursorclass=pymysql.cursors.dictcursor
    )

    try:
        # 示例1:正常查询
        with pool.get_connection() as conn:
            with conn.cursor() as cursor:
                cursor.execute("select count(*) as count from orders")
                result = cursor.fetchone()
                print(f"订单总数: {result['count']}")

        # 示例2:事务操作
        with pool.get_connection() as conn:
            try:
                with conn.cursor() as cursor:
                    # 开始事务
                    cursor.execute("start transaction")

                    # 插入新订单
                    cursor.execute(
                        "insert into orders (user_id, amount, status) values (%s, %s, %s)",
                        (1, 99.99, 'pending')
                    )

                    # 更新用户统计(模拟业务逻辑)
                    cursor.execute(
                        "update users set email = %s where id = %s",
                        ('updated@example.com', 1)
                    )

                    # 提交事务
                    conn.commit()
                    logger.info("事务提交成功")

            except exception as e:
                conn.rollback()
                logger.error(f"事务回滚: {e}")
                raise

        # 示例3:批量查询(模拟业务高峰)
        import concurrent.futures

        def query_user_orders(user_id):
            """查询用户订单"""
            with pool.get_connection() as conn:
                with conn.cursor() as cursor:
                    cursor.execute(
                        "select * from orders where user_id = %s limit 10",
                        (user_id,)
                    )
                    return cursor.fetchall()

        # 模拟并发查询
        with concurrent.futures.threadpoolexecutor(max_workers=3) as executor:
            user_ids = list(range(1, 10))
            futures = [executor.submit(query_user_orders, uid) for uid in user_ids]

            for future in concurrent.futures.as_completed(futures):
                try:
                    orders = future.result()
                    print(f"查询到 {len(orders)} 条订单")
                except exception as e:
                    logger.error(f"并发查询失败: {e}")

    finally:
        pool.close_all()

if __name__ == "__main__":
    example_usage()
这个连接池实现包含了几个关键特性:
- 连接健康检查:定期验证连接是否可用
- 慢查询日志:自动记录执行时间超过1秒的查询
- 错误处理:根据错误类型智能处理连接
- 连接追踪:记录连接使用情况,便于排查问题
五、 监控指标汇总:你需要关注哪些关键数据?
在实际项目中,你需要关注以下关键指标。我整理了一个表格,方便你快速参考:
| 监控类别 | 具体指标 | 正常范围 | 告警阈值 | 检查频率 | python获取方式 |
|---|---|---|---|---|---|
| 连接状态 | 当前连接数 | < 最大连接数80% | > 最大连接数90% | 每分钟 | show status like 'threads_connected' |
| 连接错误数 | 接近0 | 每小时>10 | 每小时 | show status like 'connection_errors%' | |
| 查询性能 | 慢查询数量 | 接近0 | 每分钟>5 | 实时 | 慢查询日志 |
| 平均查询时间 | < 100ms | > 500ms | 每分钟 | performance schema | |
| qps(每秒查询) | 根据业务定 | 突增100% | 每分钟 | show status like 'queries' | |
| 资源使用 | innodb缓冲池命中率 | > 95% | < 90% | 每分钟 | show status like 'innodb_buffer_pool%' |
| 临时表磁盘使用 | 接近0 | > 100mb | 每小时 | show status like 'created_tmp%' | |
| 复制状态 | 主从延迟 | < 1秒 | > 5秒 | 每分钟 | show slave status |
六、 生产环境部署建议
当你掌握了基本监控配置后,在生产环境中我建议:
分层监控:
- 基础设施层:服务器cpu、内存、磁盘
- mysql层:连接数、慢查询、锁等待
- 应用层:python连接池状态、查询耗时
告警策略:
- 紧急告警(电话/短信):数据库宕机、连接池耗尽
- 重要告警(邮件/钉钉):慢查询突增、主从延迟
- 提醒通知(邮件):磁盘空间不足、备份完成
日志管理:
# 生产环境日志配置示例
import logging
from logging.handlers import rotatingfilehandler, timedrotatingfilehandler

# 按大小轮转的日志文件
size_handler = rotatingfilehandler(
    'mysql_operations.log',
    maxbytes=100*1024*1024,  # 100mb
    backupcount=10
)

# 按时间轮转的日志文件
time_handler = timedrotatingfilehandler(
    'mysql_slow_queries.log',
    when='midnight',  # 每天轮转
    backupcount=30
)

# 发送到监控系统(如elk)
# 可以使用logstash handler或直接api发送
七、 总结与进阶方向
恭喜你!现在你已经掌握了python mysql监控与日志配置的核心技能。让我们回顾一下今天的收获:
7.1 核心要点总结
- 慢查询日志是性能优化的起点,配置简单但效果显著
- performance schema提供实时、低开销的性能数据
- python端的健康检查能提前发现连接问题
- 分层监控和合理告警是生产环境的必备
7.2 我当年踩过的坑
坑1:开启了慢查询日志但没定期清理,磁盘被撑满
解决方案:配置日志轮转,或使用pt-query-digest分析后清理
坑2:监控指标太多,反而找不到重点
解决方案:先关注连接数、慢查询、缓冲池命中率这三个核心指标
坑3:python连接泄露,导致连接数缓慢增长
解决方案:使用上下文管理器(with语句),确保连接总是被正确归还
7.3 进阶学习方向
如果你想深入mysql监控,我建议按这个路径学习:
- 监控工具:学习使用percona monitoring and management (pmm) 或 vividcortex
- sql优化:深入理解explain执行计划,学习索引优化技巧
- 架构设计:了解读写分离、分库分表下的监控策略
- 自动化:使用ansible/terraform自动化监控部署
到此这篇关于python中mysql监控与日志配置实战指南的文章就介绍到这了,更多相关python mysql监控内容请搜索代码网以前的文章或继续浏览下面的相关文章希望大家以后多多支持代码网!


发表评论