本文所展示的代码是一个完整的数据采集、处理与可视化工具,主要用于从指定网站下载excel文件,解析其中的数据,并生成投资者数量的趋势图表。以下是代码的主要功能模块及其作用:
1.网页数据获取
使用fetch_html_page函数从目标网站抓取html页面内容。
通过parse_html_for_excel_links解析html内容,提取所有excel文件链接。
利用parse_html_for_max_page解析最大分页数,确保能够遍历所有页面。
2.文件下载与存储
download_excel_file负责根据excel文件的url下载文件并保存到本地指定路径。
download_excel_data实现批量下载功能,支持多页数据的完整采集。
3.数据读取与处理
read_excel_file使用pandas库读取excel文件内容。
process_excel_data将excel数据转换为字典格式,便于后续处理。
process_downloaded_files批量处理下载的excel文件,提取关键数据并存储为列表。
4.数据可视化
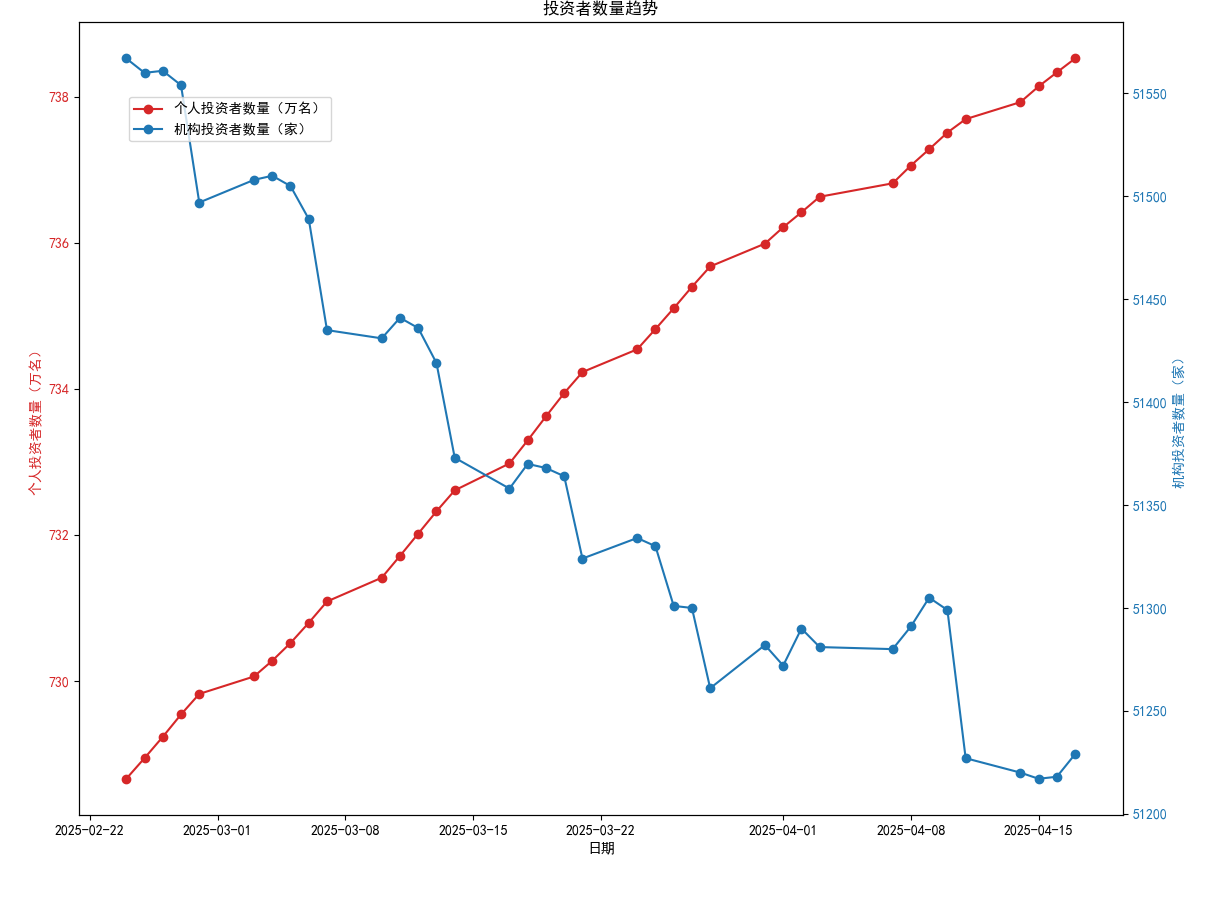
plot_investor_trends利用matplotlib绘制双y轴折线图,展示个人投资者和机构投资者的数量变化趋势。
图表包含日期、个人投资者数量(万名)和机构投资者数量(家),并通过不同颜色区分数据系列。
整体流程
代码从指定网站抓取数据,自动下载相关excel文件。
解析excel文件中的投资者数据,并生成趋势图表以直观展示数据变化。
import warnings

import requests
from bs4 import beautifulsoup
import pandas as pd
import os
import re
import matplotlib

# 设置matplotlib的字体配置,以支持中文显示
matplotlib.rcparams['font.sans-serif'] = ['simhei']  # 或者 ['microsoft yahei']
matplotlib.rcparams['axes.unicode_minus'] = false
matplotlib.use('tkagg')
from matplotlib import pyplot as plt


def fetch_html_page(url):
    """
    获取html页面内容。

    参数:
    url (str): 目标网页的url。

    返回:
    str: 页面的html内容,如果请求失败则返回none。
    """
    headers = {
        "user-agent": "mozilla/5.0 (windows nt 10.0; win64; x64) applewebkit/537.36 (khtml, like gecko) chrome/91.0.4472.124 safari/537.36"
    }
    response = requests.get(url, headers=headers)
    if response.status_code == 200:
        print(f"成功获取页面: {url}")
        return response.text
    else:
        print(f"error: {response.status_code}, {response.text}")
        return none


def parse_html_for_excel_links(html_content):
    """
    解析html内容中的excel链接。

    参数:
    html_content (str): html页面内容。

    返回:
    list: 包含所有找到的excel文件链接的列表。
    """
    soup = beautifulsoup(html_content, 'html.parser')
    excel_links = []
    for a_tag in soup.find_all('a', href=true):
        href = a_tag.get('href')
        if href and href.endswith('.xlsx'):
            excel_links.append(href)
    return excel_links


def parse_html_for_max_page(html_content):
    """
    解析html内容以找到最大页面数。

    参数:
    html_content (str): html页面内容。

    返回:
    int: 最大页面数。
    """
    soup = beautifulsoup(html_content, 'html.parser')
    max_page = 1
    for a_tag in soup.find_all('a', class_='pagingnormal'):
        onclick = a_tag.get('onclick')
        if onclick:
            match = re.search(r"'(/test/j/[^']+)'", onclick)
            if match:
                page_number = match.group(1).split('-')[-1].split('.')[0]
                max_page = max(max_page, int(page_number))
    return max_page


def download_excel_file(url, save_path):
    """
    下载excel文件并保存到指定路径。

    参数:
    url (str): excel文件的url。
    save_path (str): 文件的保存路径。
    """
    headers = {
        "user-agent": "mozilla/5.0 (windows nt 10.0; win64; x64) applewebkit/537.36 (khtml, like gecko) chrome/91.0.4472.124 safari/537.36"
    }
    response = requests.get(url, headers=headers)
    if response.status_code == 200:
        with open(save_path, 'wb') as f:
            f.write(response.content)
        print(f"下载完成: {save_path}")
    else:
        print(f"error: {response.status_code}, {response.text}")


def download_excel_data():
    """
    下载所有excel数据文件。
    """
    base_url = 'https://test/index.html'  # 替换为实际网页地址
    current_url = base_url
    page_number = 1

    html_content = fetch_html_page(current_url)
    if not html_content:
        return

    max_page = parse_html_for_max_page(html_content)
    print(f"最大页面数: {max_page}")

    while page_number <= max_page:
        print(f"正在处理第 {page_number} 页: {current_url}")
        html_content = fetch_html_page(current_url)
        if not html_content:
            break

        excel_links = parse_html_for_excel_links(html_content)
        if not excel_links:
            print("未找到excel链接。")
            break

        for link in excel_links:
            full_url = f"https://www.test.cn{link}"
            # 提取日期和文件名部分
            file_path_parts = link.split('/')
            file_name = ('/'.join(file_path_parts[-3:-1]) + '/' + file_path_parts[-1]).replace('/', '-')
            save_path = os.path.join('downloads', file_name)
            os.makedirs(os.path.dirname(save_path), exist_ok=true)
            download_excel_file(full_url, save_path)

        if page_number < max_page:
            next_page_link = f"/test/d2bb5c19-{page_number + 1}.html"
            current_url = f"https://www.test.cn{next_page_link}"
            page_number += 1
        else:
            print("没有更多页面。")
            break


def read_excel_file(file_path):
    """
    读取excel文件内容。

    参数:
    file_path (str): excel文件的路径。

    返回:
    dataframe: 读取到的excel文件内容,如果读取失败则返回none。
    """
    try:
        with warnings.catch_warnings():
            warnings.simplefilter("ignore", userwarning)
            df = pd.read_excel(file_path, engine='openpyxl', header=none)
        return df
    except exception as e:
        print(f"读取excel文件时出错: {e}")
        return none


def process_excel_data(df):
    """
    处理excel数据,将其转换为字典格式。

    参数:
    df (dataframe): excel文件内容。

    返回:
    dict: 转换后的字典数据。
    """
    if df is none:
        return {}

    # 处理合并单元格
    # df = df.fillna(method='ffill').fillna(method='bfill')

    # 将数据转换为字典
    data_dict = {}
    current_section = none
    for index, row in df.iterrows():
        if index == 1:  # 第二行
            key = row[1]
            if pd.isnull(key):
                key = df.iloc[1, 0]
            value = row[2] if pd.notnull(row[2]) else none
            data_dict[key] = value
        elif index > 1:
            if pd.notnull(row[0]):
                current_section = row[0]
                data_dict[current_section] = {}
            if pd.notnull(row[1]):
                key = row[1]
                value = row[2] if pd.notnull(row[2]) else none
                data_dict[current_section][key] = value

    return data_dict


def process_downloaded_files(directory):
    """
    处理下载的excel文件,提取数据。

    参数:
    directory (str): 存放下载文件的目录路径。

    返回:
    list: 包含所有处理后的数据字典的列表。
    """
    data_list = []
    for filename in os.listdir(directory):
        if filename.endswith('.xlsx'):
            file_path = os.path.join(directory, filename)
            df = read_excel_file(file_path)
            if df is not none:
                print(f"处理文件: {filename}")
                data_dict = process_excel_data(df)
                print(data_dict)  # 打印处理后的字典
                data_list.append(data_dict)
    return data_list


def plot_investor_trends(data_list):
    """
    绘制投资者数量趋势图。

    参数:
    data_list (list): 包含投资者数据的列表。
    """
    # 提取时间值和投资者数量
    dates = []
    individual_investors = []
    institutional_investors = []

    for data_dict in data_list:
        date_str = data_dict['统计指标']
        date = pd.to_datetime(date_str)
        dates.append(date)
        individual_investors.append(data_dict['证券公司开展业务情况']['个人投资者数量(万名)'])
        institutional_investors.append(data_dict['证券公司开展业务情况']['机构投资者数量(家)'])

    # 创建折线图
    fig, ax1 = plt.subplots(figsize=(10, 6))

    # 绘制个人投资者数量
    color = 'tab:red'
    ax1.set_xlabel('日期')
    ax1.set_ylabel('个人投资者数量(万名)', color=color)
    ax1.plot(dates, individual_investors, color=color, label='个人投资者数量(万名)', marker='o')
    ax1.tick_params(axis='y', labelcolor=color)

    # 创建第二个 y 轴
    ax2 = ax1.twinx()  # 共享 x 轴

    # 绘制机构投资者数量
    color = 'tab:blue'
    ax2.set_ylabel('机构投资者数量(家)', color=color)
    ax2.plot(dates, institutional_investors, color=color, label='机构投资者数量(家)', marker='o')
    ax2.tick_params(axis='y', labelcolor=color)

    # 设置标题和图例
    fig.tight_layout()  # 调整子图参数,防止标签重叠
    plt.title('投资者数量趋势')
    fig.legend(loc='upper left', bbox_to_anchor=(0.1, 0.9))

    # 显示图形
    plt.show()


# 调用函数绘制投资者趋势图
plot_investor_trends(process_downloaded_files('downloads'))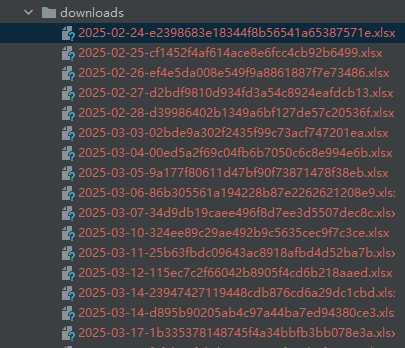
到此这篇关于利用python抓取html页面数据并作可视化数据分析的文章就介绍到这了,更多相关python抓取html页面数据内容请搜索代码网以前的文章或继续浏览下面的相关文章希望大家以后多多支持代码网!


发表评论