golang程序查找内存泄漏
1. 在main包中
选择在一个单独文件中加上pprof包引用并设置条件编译,这样不会与develop正式版本代码产生任何耦合。
// +build debug

package main

import (
	"net/http"
	_ "net/http/pprof"
)

func init() {
	go http.listenandserve(":18080", nil)
}
2. 编译
go build -tags debug .
3. 在目标机中运行刚编译出来的debug版本程序
本例中ip为随意编写的。
4. 执行
go tool pprof -inuse_space http://192.168.20.5:18080/debug/pprof/heap进入交互模式:
[user@laptop-lcp testtool]$ go tool pprof -inuse_space http://192.168.20.5:18080/debug/pprof/heap
fetching profile over http from http://192.168.20.5:18080/debug/pprof/heap
saved profile in c:\users\noname\pprof\pprof.testtool.alloc_objects.alloc_space.inuse_objects.inuse_space.006.p
b.gz
file: testtool
type: inuse_space
time: aug 16, 2022 at 2:24pm (cst)
entering interactive mode (type "help" for commands, "o" for options)
(pprof) top 10
showing nodes accounting for 27831.78kb, 100% of 27831.78kb total
showing top 10 nodes out of 35
flat flat% sum% cum cum%
11787.50kb 42.35% 42.35% 11787.50kb 42.35% runtime.allocm
9382.95kb 33.71% 76.07% 9382.95kb 33.71% io.readall
2561.02kb 9.20% 85.27% 2561.02kb 9.20% runtime.malg
1536.21kb 5.52% 90.79% 1536.21kb 5.52% github.com/aws/aws-sdk-go/aws/endpoints.init
514kb 1.85% 92.63% 514kb 1.85% bufio.newreadersize
514kb 1.85% 94.48% 514kb 1.85% bufio.newwritersize
512.08kb 1.84% 96.32% 512.08kb 1.84% net/http.newtransferwriter
512.02kb 1.84% 98.16% 512.02kb 1.84% runtime.gcbgmarkworker
512kb 1.84% 100% 512kb 1.84% runtime.doaddtimer
0 0% 100% 9382.95kb 33.71% io/ioutil.readall
(pprof)
(pprof)
交互界面使用top命令查看内存分配最多的函数。
如果本机中有源代码,可以使用list命令查看源代码中哪一行分配的函数最多。
(pprof)
(pprof) list io.readall
total: 27.18mb
routine ======================== io.readall in c:\program files\go\src\io\io.go
9.16mb 9.16mb (flat, cum) 33.71% of total
. . 626:func readall(r reader) ([]byte, error) {
. . 627: b := make([]byte, 0, 512)
. . 628: for {
. . 629: if len(b) == cap(b) {
. . 630: // add more capacity (let append pick how much).
9.16mb 9.16mb 631: b = append(b, 0)[:len(b)]
. . 632: }
. . 633: n, err := r.read(b[len(b):cap(b)])
. . 634: b = b[:len(b)+n]
. . 635: if err != nil {
. . 636: if err == eof {
(pprof)
(pprof)
5. 也可以使用以下命令直接导出调用图
非常直观(需要安装graphviz,详询download | graphviz)
go tool pprof -inuse_space -png http://192.168.20.5:18080/debug/pprof/heap > heap.png
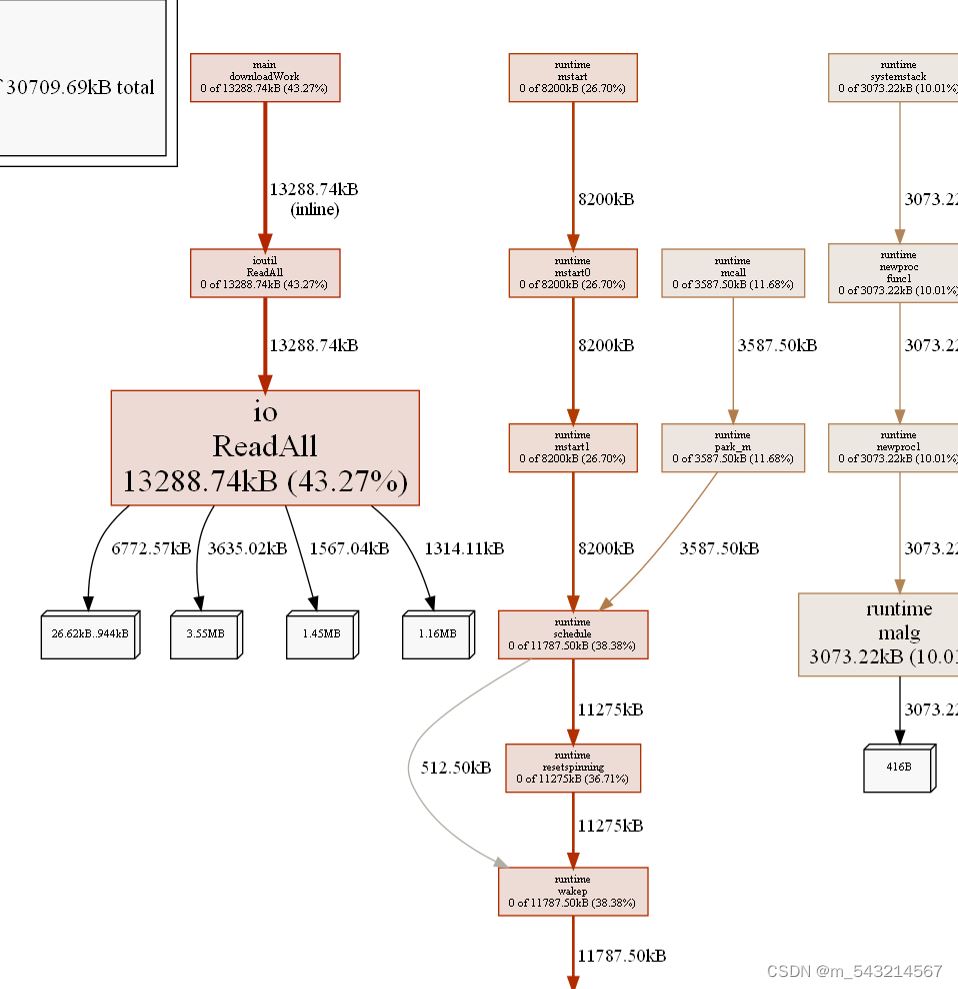
可以在图片中直观地看到,调用过程中每个函数的内存使用占比。
出现内存泄漏时,如果只查看一次很难确定真正出现内存泄露的代码位置,可以在程序运行一段时间后,程序出现内存泄露已经很明显后,再次查看内存占用分析图,找到两张图中内存占用比例相差最大的函数。
总结
以上为个人经验,希望能给大家一个参考,也希望大家多多支持代码网。


发表评论