ransac为random sample consensus随机样本一致算法的缩写,它是根据一组包含异常数据的样本数据集,计算出数据的数学模型参数,得到有效样本数据的算法。它于1981年由fischler和bolles最先提出。
ransac算法经常用于计算机视觉中。例如,在立体视觉领域中同时解决一对相机的匹配点问题及基本矩阵的计算。
算法流程
ransac 通过反复选择数据中的一组随机子集来达成目标。被选取的子集被假设为局内点,并用下述方法进行验证:
- 一个模型适用于假设的局内点,即所有的未知参数都能从假设的局内点计算得出。
- 用1中得到的模型去测试所有的其它数据,如果某个点适用于估计的模型,认为它也是局内点。
- 如果有足够多的点被归类为假设的局内点,那么估计的模型就足够合理。
- 然后,用所有假设的局内点去重新估计模型,因为它仅仅被初始的假设局内点估计过。
- 最后,通过估计局内点与模型的错误率来评估模型。
算法的问题
- 随机找点作为“内点”多少有点随机。但这个会影响算法嘛?有更好的办法嘛?
- 如何判断模型好坏?
- 如何设置内外点的判断条件?
迭代次数推导
迭代的次数,是可以估算出来的。假设“内点”在数据中的占比为p:


“内点”的概率 p 通常是一个先验值。然后z是我们希望 ransac 得到正确模型的概率。如果事先不知道p的值,可以使用自适应迭代次数的方法。也就是一开始设定一个无穷大的迭代次数,然后每次更新模型参数估计的时候,用当前的“内点”比值当成p来估算出迭代次数。
python拟合平面圆
import numpy as np
import matplotlib.pyplot as plt
def fit_circle(points):
"""fit a circle to the given points using least squares method."""
x, y = points[:, 0], points[:, 1]
a = np.vstack([-x, -y, np.ones(len(x))]).t
#print(a.shape)
b = -np.array([x ** 2 + y ** 2]).t
# print(b.shape)
c_matrix = a.t.dot(a)
result = np.linalg.inv(c_matrix).dot(a.t.dot(b))
#print(result.shape)
center = [result[0] * 0.5, result[1] * 0.5]
return center, np.sqrt(center[0] ** 2 + center[1] ** 2 - result[2])
# (x-a)^2+(y-b)*2=^2
# x^2 + a^2 - 2ax + y^2 + b^2 - 2bx =r^2
# -2ax -2by + a^2 + b^2 - r^2 = - (x^2 + y^2)
# [-x -y 1] [2a 2b (a^2 + b^2 - r^2) ] = - (x^2 + y^2)
#center = np.linalg.lstsq(a, y, rcond=none)[0]
#radius = np.sqrt((center[0]**2 + center[1]**2 - (x**2 + y**2).mean())**2)
#return center, radius
def ransac_circle(points, max_trials=1000, threshold=1):
"""fit a circle to points using the ransac algorithm."""
best_fit = 0
best_error = np.inf
n_points = len(points)
for _ in range(max_trials):
sample_indices = np.random.choice(n_points, 3, replace=false)
sample_points = points[sample_indices]
center, radius = fit_circle(sample_points)
# calculate distance from each point to the fitted circle
distances = np.sqrt((points[:, 0] - center[0])**2 + (points[:, 1] - center[1])**2) # - radius
inliers = np.logical_and( np.abs(distances) <= (radius + threshold) , np.abs(distances) >= (radius - threshold))
# check if this is the best fit so far
if sum(inliers) > best_fit:
best_fit = sum(inliers)
center, radius = fit_circle(points[inliers])
best_center = center
best_radius = radius
best_inliers = inliers
return best_center, best_radius, best_inliers
# generate some example data points including noise
# np.random.seed(0)
n_samples = 100
true_center = (1, 0)
true_radius = 10
angles = np.linspace(0, 2 * np.pi, n_samples)
true_points = np.vstack([true_center[0] + true_radius * np.cos(angles),
true_center[1] + true_radius * np.sin(angles)]).t
noise = np.random.normal(size=(n_samples, 2), scale=1)
points = true_points + noise
# fit circle using ransac
center, radius, inliers = ransac_circle(points, max_trials=1000, threshold=1.5)
# plot results
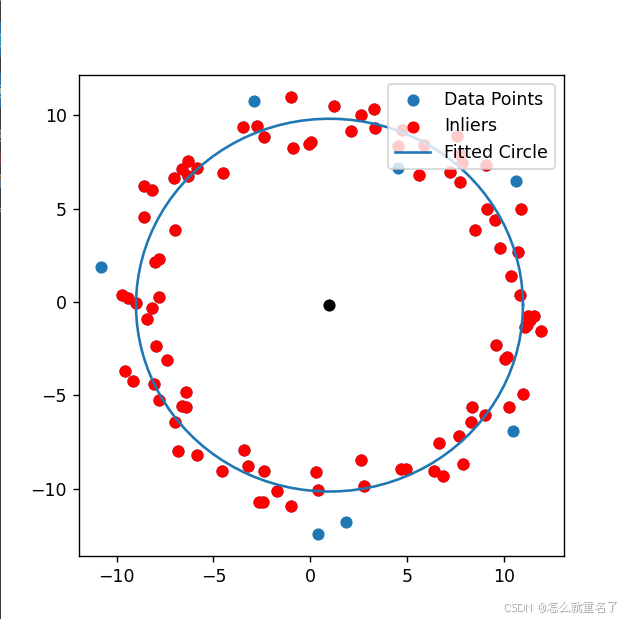
print(f"true_center {true_center}, true_radius {true_radius} ")
print(f"center {center}, radius {radius} ")
plt.figure(figsize=(5, 5))
plt.scatter(points[:, 0], points[:, 1], label='data points')
plt.scatter(points[inliers, 0], points[inliers, 1], color='red', label='inliers')
plt.scatter([center[0]], [center[1]], color='black')
theta = np.linspace(0, 2 * np.pi, 100)
plt.plot(center[0] + radius * np.cos(theta), center[1] + radius * np.sin(theta), label='fitted circle')
plt.legend(loc='upper right')
plt.show()
拟合直线
import numpy as np
import matplotlib.pyplot as plt
import random
import math
# 数据量。
size = 50
# 产生数据。np.linspace 返回一个一维数组,size指定数组长度。
# 数组最小值是0,最大值是10。所有元素间隔相等。
x = np.linspace(0, 10, size)
y = 3 * x + 10
fig = plt.figure()
# 画图区域分成1行1列。选择第一块区域。
ax1 = fig.add_subplot(1,1, 1)
# 标题
ax1.set_title("ransac")
# 让散点图的数据更加随机并且添加一些噪声。
random_x = []
random_y = []
# 添加直线随机噪声
for i in range(size):
random_x.append(x[i] + random.uniform(-0.5, 0.5))
random_y.append(y[i] + random.uniform(-0.5, 0.5))
# 添加随机噪声
for i in range(size):
random_x.append(random.uniform(0,10))
random_y.append(random.uniform(10,40))
random_x = np.array(random_x) # 散点图的横轴。
random_y = np.array(random_y) # 散点图的纵轴。
# 画散点图。
ax1.scatter(random_x, random_y)
# 横轴名称。
ax1.set_xlabel("x")
# 纵轴名称。
ax1.set_ylabel("y")
# 使用ransac算法估算模型
# 迭代最大次数,每次得到更好的估计会优化iters的数值
iters = 100000
# 数据和模型之间可接受的差值
sigma = 1
# 最好模型的参数估计和内点数目
best_a = 0
best_b = 0
pretotal = 0
# 保存的最好的内点
best_inner_x = []
best_inner_y = []
# 希望的得到正确模型的概率
p = 0.99
for i in range(iters):
print("i", i)
# 随机在数据中红选出两个点去求解模型
sample_index = random.sample(range(size * 2),2)
x_1 = random_x[sample_index[0]]
x_2 = random_x[sample_index[1]]
y_1 = random_y[sample_index[0]]
y_2 = random_y[sample_index[1]]
# y = ax + b 求解出a,b
a = (y_2 - y_1) / (x_2 - x_1)
b = y_1 - a * x_1
# 算出内点数目
total_inlier = 0
best_inner_x_dummpy = []
best_inner_y_dummpy = []
for index in range(size * 2):
y_estimate = a * random_x[index] + b
if abs(y_estimate - random_y[index]) < sigma:
best_inner_x_dummpy.append(random_x[index])
best_inner_y_dummpy.append(random_y[index])
total_inlier = total_inlier + 1
# 判断当前的模型是否比之前估算的模型好
if total_inlier > pretotal:
iters = math.log(1 - p) / math.log(1 - pow(total_inlier / (size * 2), 2))
pretotal = total_inlier
best_a = a
best_b = b
best_inner_x = best_inner_x_dummpy
best_inner_y = best_inner_y_dummpy
print(f"iters {iters}, pretotal {pretotal}, best_a {best_a}, best_b {best_b}")
if i >= iters:
break
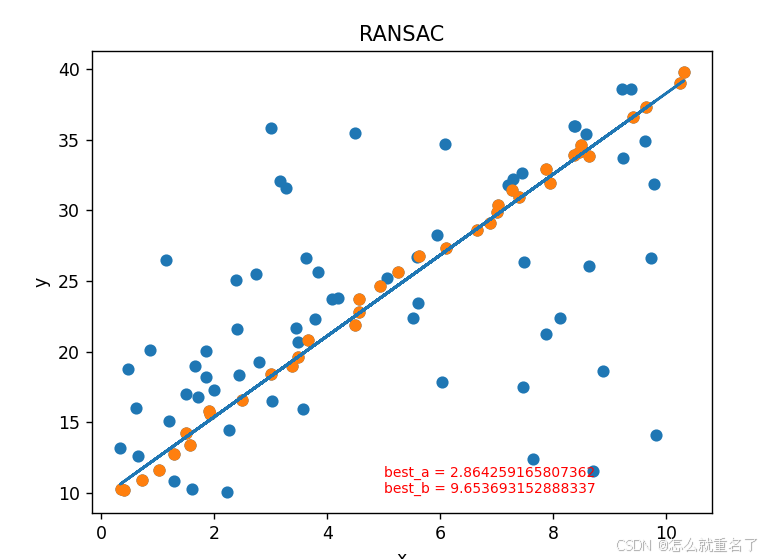
# 用我们得到的最佳估计画图
y = best_a * random_x + best_b
# 直线图
ax1.plot(random_x, y)
# 画散点图。
ax1.scatter(best_inner_x, best_inner_y)
text = "best_a = " + str(best_a) + "\nbest_b = " + str(best_b)
plt.text(5,10, text, fontdict={'size': 8, 'color': 'r'})
plt.show()
到此这篇关于python中ransac算法拟合圆的实现的文章就介绍到这了,更多相关python ransac拟合圆内容请搜索代码网以前的文章或继续浏览下面的相关文章希望大家以后多多支持代码网!


发表评论