tomcat安装配置以及prometheus监控tomcat
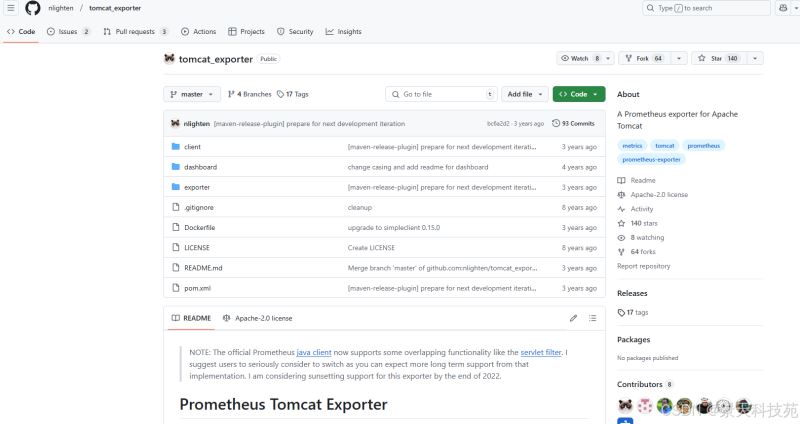
tomcat本身无法对外提供prometheus所兼容的metrics,因此需要借助第三方exporter来提供:tomcat-exporter
https://github.com/nlighten/tomcat_exporter
一. 安装并配置tomcat
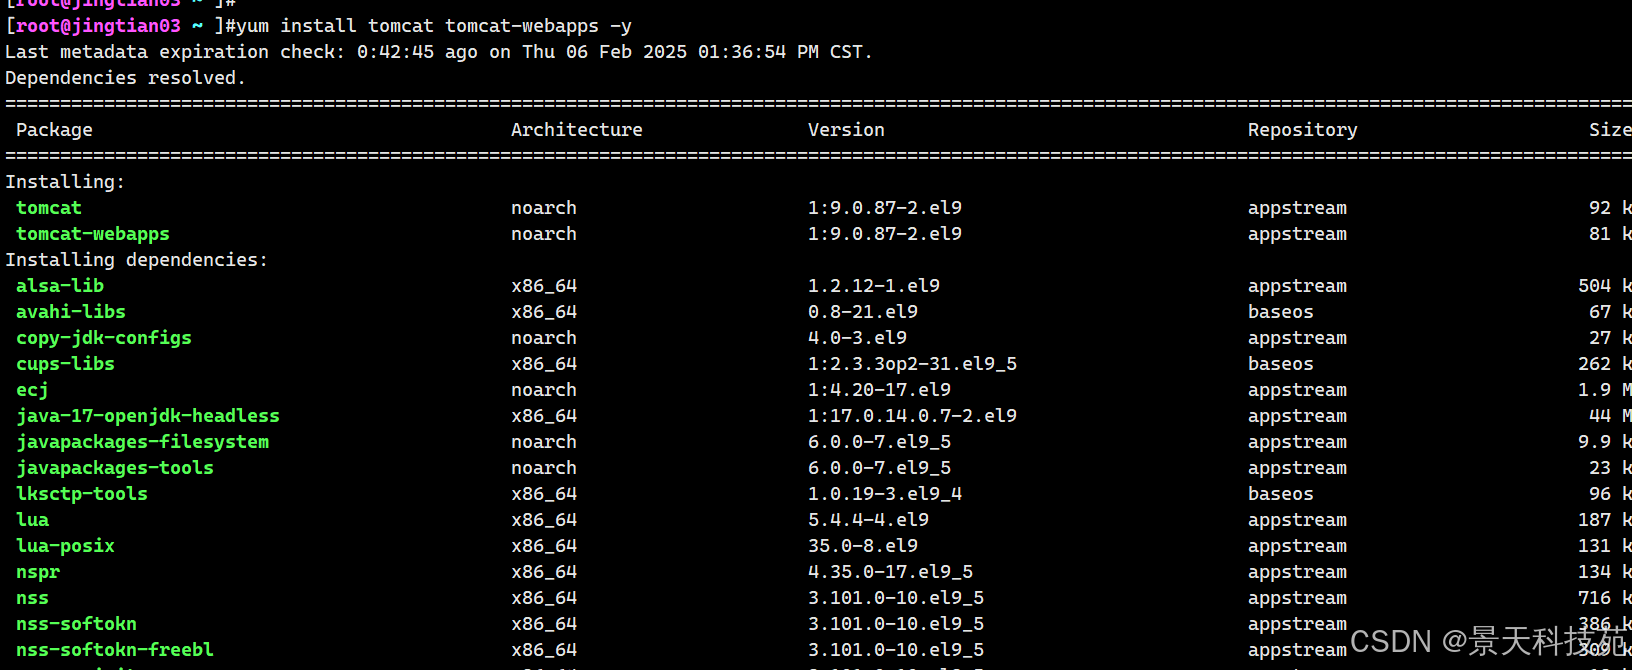
1、安装tomcat
yum install tomcat tomcat-webapps -y
2、然后下载依赖包
我们可以看到官方介绍,需要很多依赖包
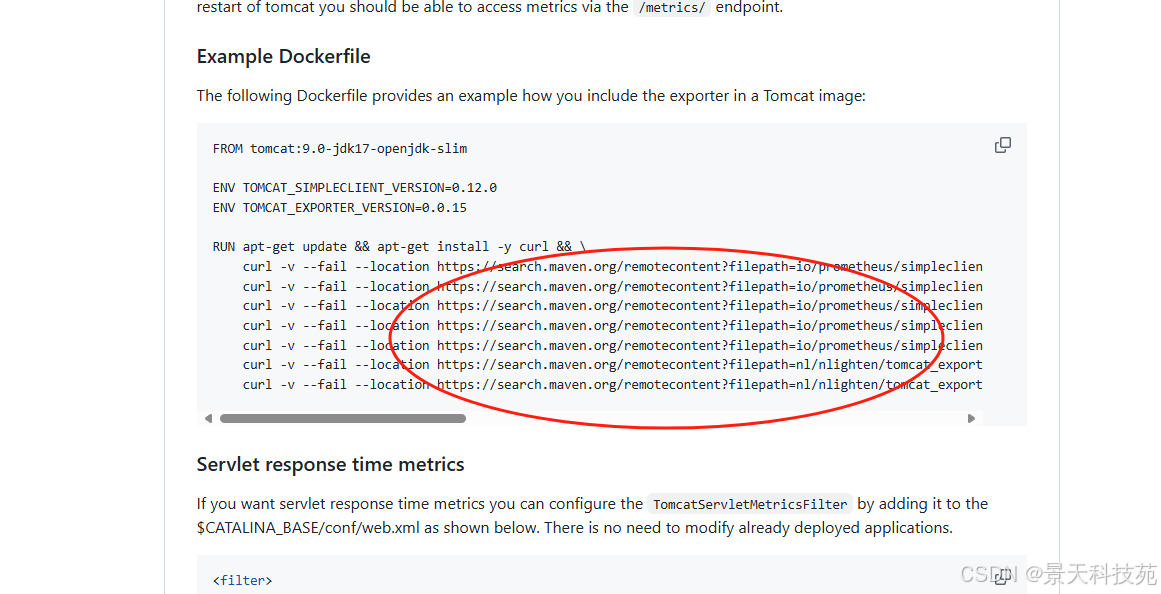
wget https://search.maven.org/remotecontent?filepath=io/prometheus/simpleclient/0.12.0/simpleclient-0.12.0.jar
wget https://search.maven.org/remotecontent?filepath=io/prometheus/simpleclient_common/0.12.0/simpleclient_common-0.12.0.jar
wget https://search.maven.org/remotecontent?filepath=io/prometheus/simpleclient_hotspot/0.12.0/simpleclient_hotspot-0.12.0.jar
wget https://search.maven.org/remotecontent?filepath=io/prometheus/simpleclient_servlet/0.12.0/simpleclient_servlet-0.12.0.jar
wget https://search.maven.org/remotecontent?filepath=io/prometheus/simpleclient_servlet_common/0.12.0/simpleclient_servlet_common-0.12.0.jar
wget https://search.maven.org/remotecontent?filepath=nl/nlighten/tomcat_exporter_client/0.0.15/tomcat_exporter_client-0.0.15.jar
wget https://search.maven.org/remotecontent?filepath=nl/nlighten/tomcat_exporter_servlet/0.0.15/tomcat_exporter_servlet-0.0.15.war
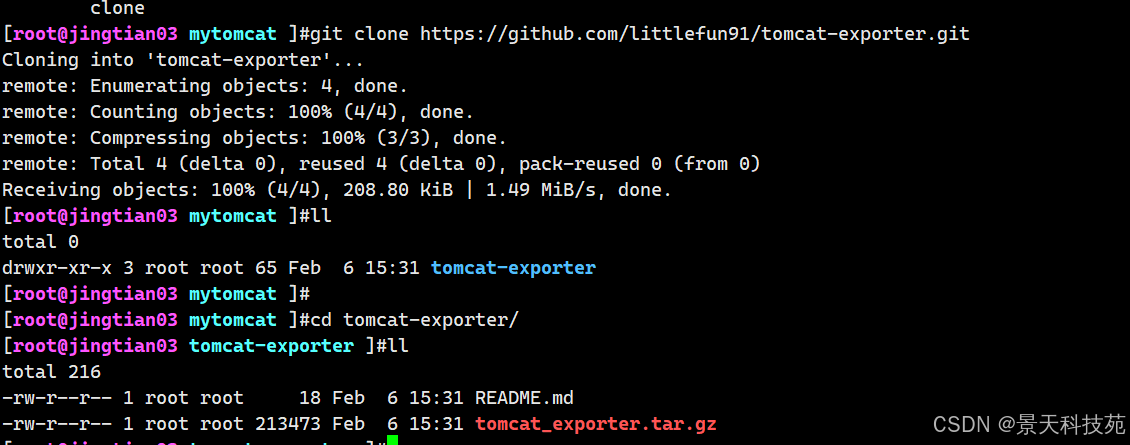
当然也可以一次性全部下载
git clone https://github.com/littlefun91/tomcat-exporter.git
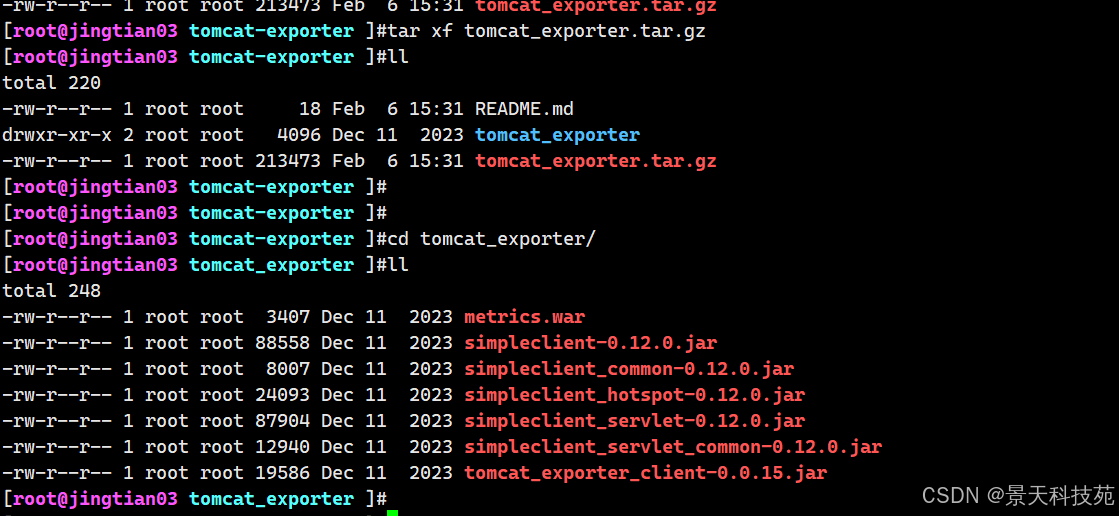
3、将jar包和war包分别拷贝至对应的目录下
[root@jingtian03 tomcat_exporter ]#cp *.jar /usr/share/tomcat/lib/
[root@jingtian03 tomcat_exporter ]#cp *.war /usr/share/tomcat/webapps/
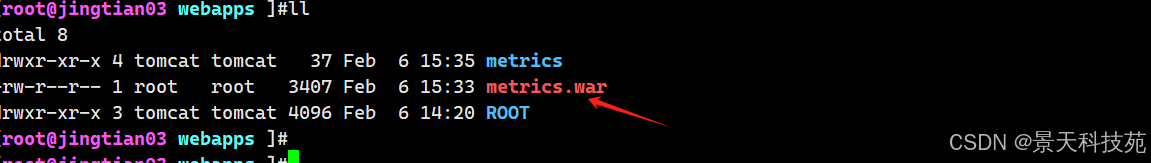
启动后,metrics.war自动解压
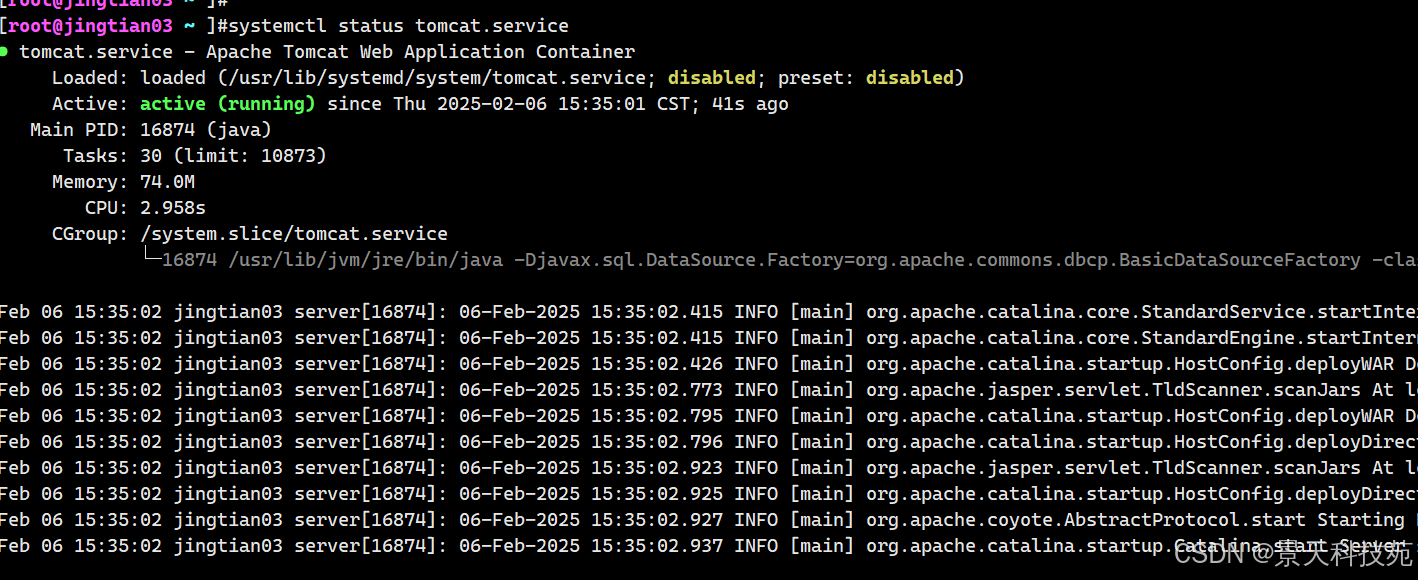
4、启动tomcat
systemctl start tomcat.service
查看运行状态
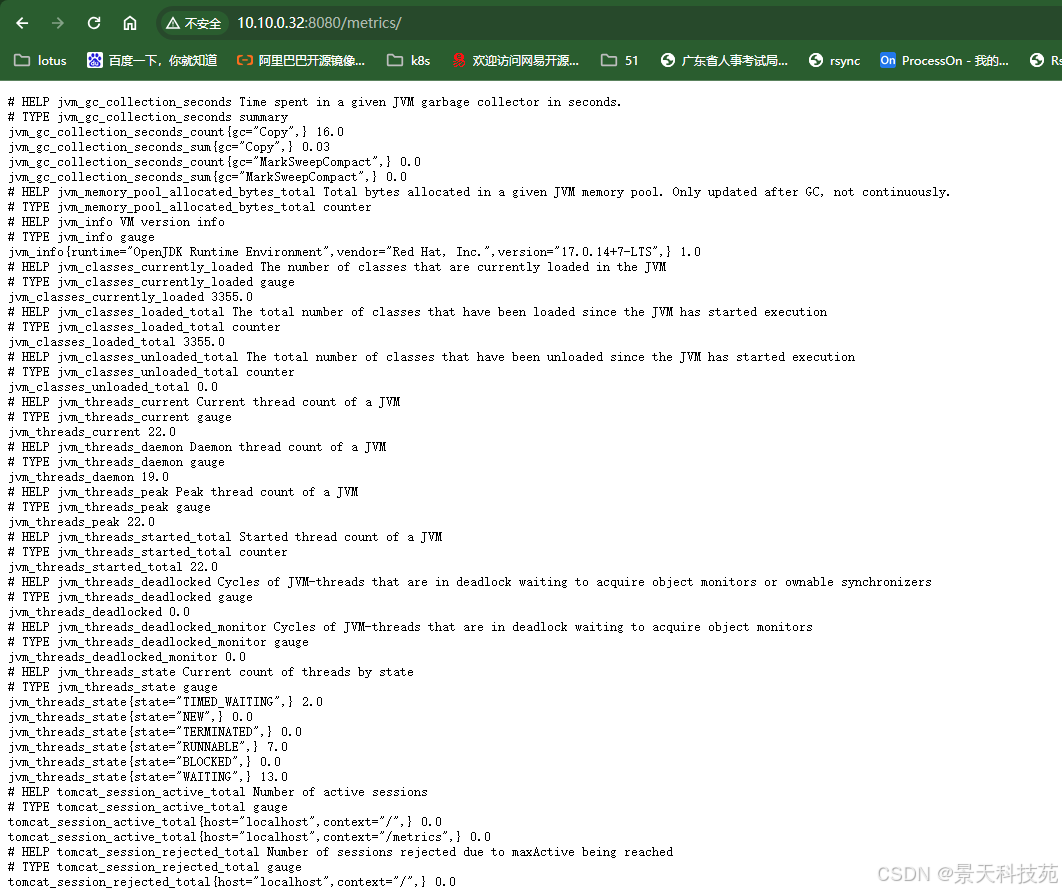
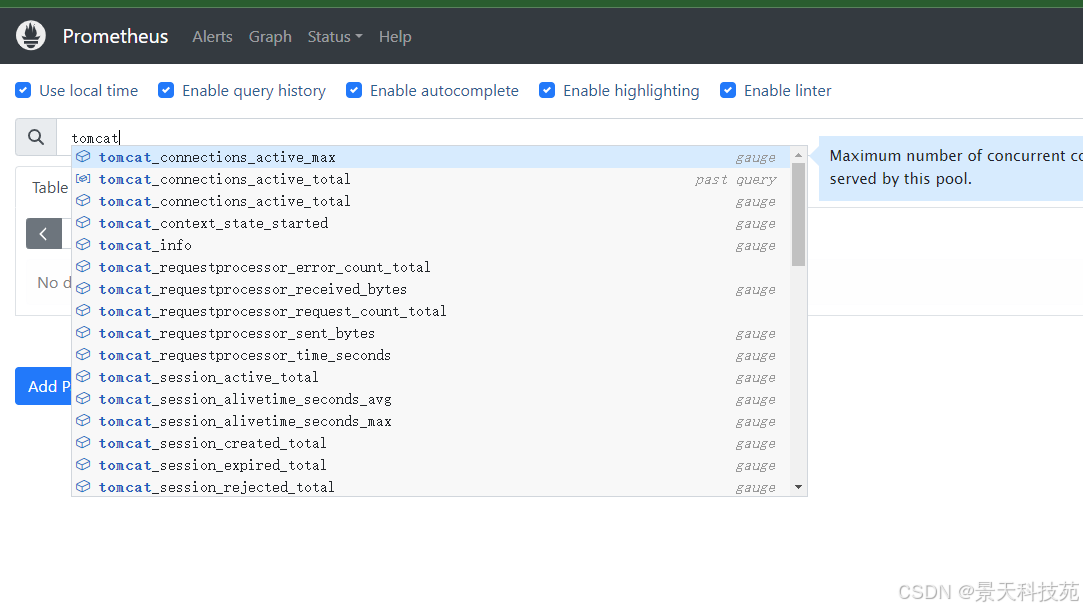
5、访问tomcat的metrics
http://10.10.0.32:8080/metrics/
6、配置prometheus
编辑prometheus配置文件,将tomcat纳入监控
  - job_name: "tomcat"
    static_configs:
      - targets: ["jingtian03:8080"]
重新加载prometheus配置文件
curl -x post http://localhost:9090/-/reload
检查prometheus的status->targets页面,验证tomcat是否已经成功纳入监控中
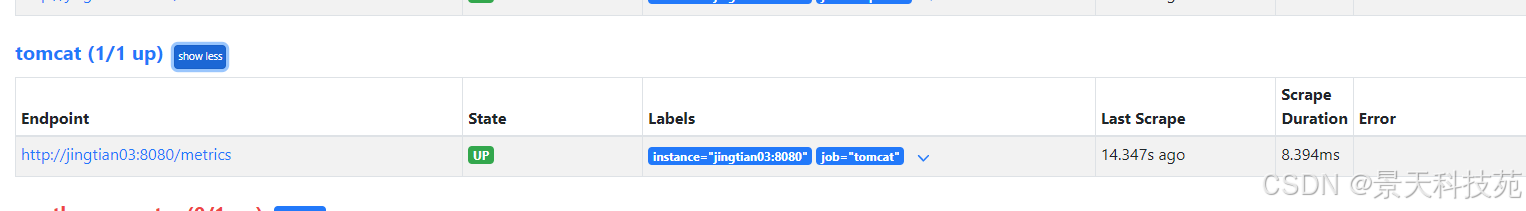
可以看到tomcat相关指标
二. tomcat常用指标与示例
对于 tomcat,我们通常会使用red 方法,监控请求速率(rate)、请求失败数(errors)、请求延迟(duration)来评估当前服务的质量。
1.tomcat连接相关指标
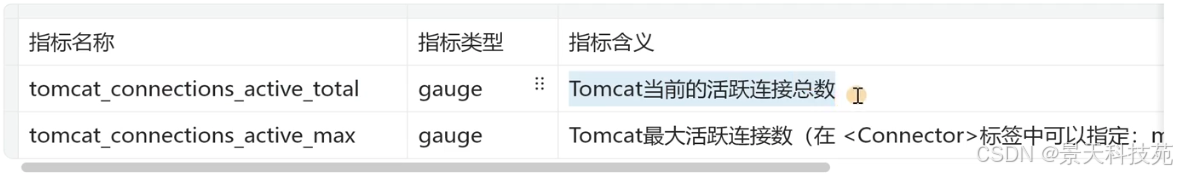
最大连接数可以修改
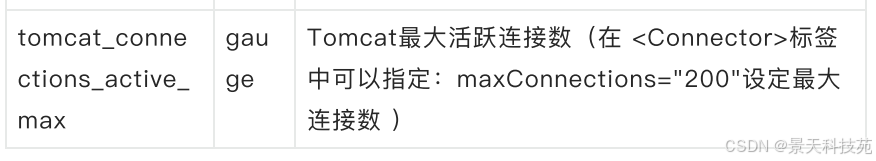
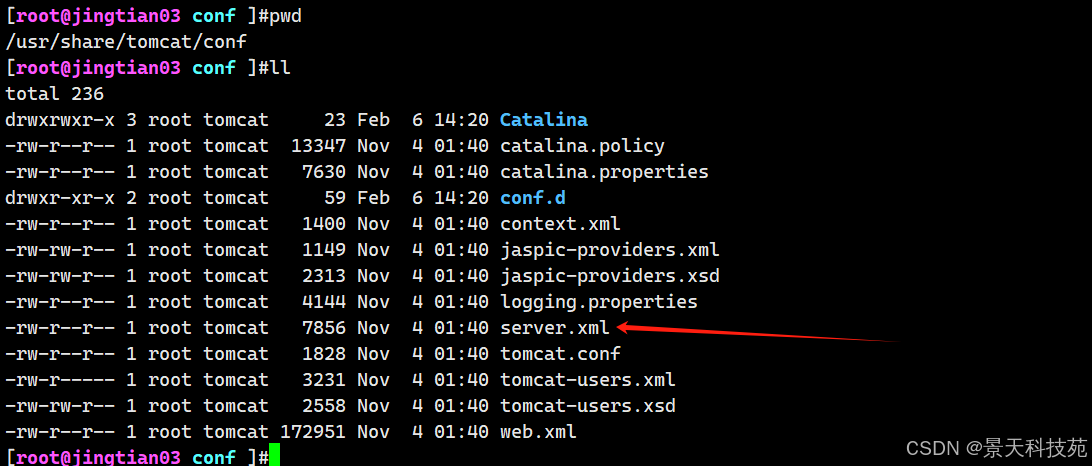
在/usr/share/tomcat/conf/server.xml中修改
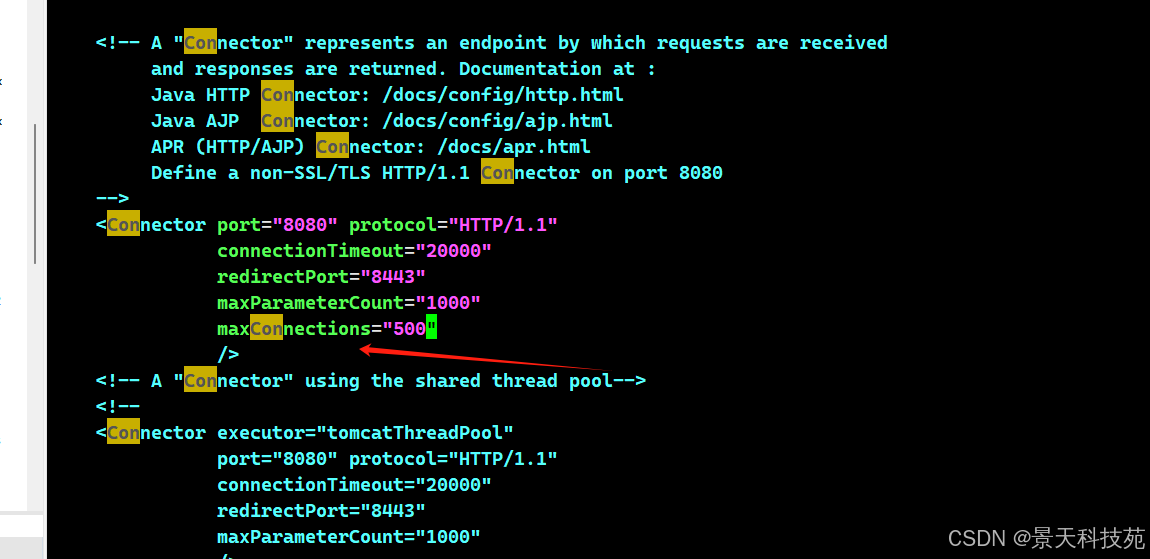
重启tomcat,再看下
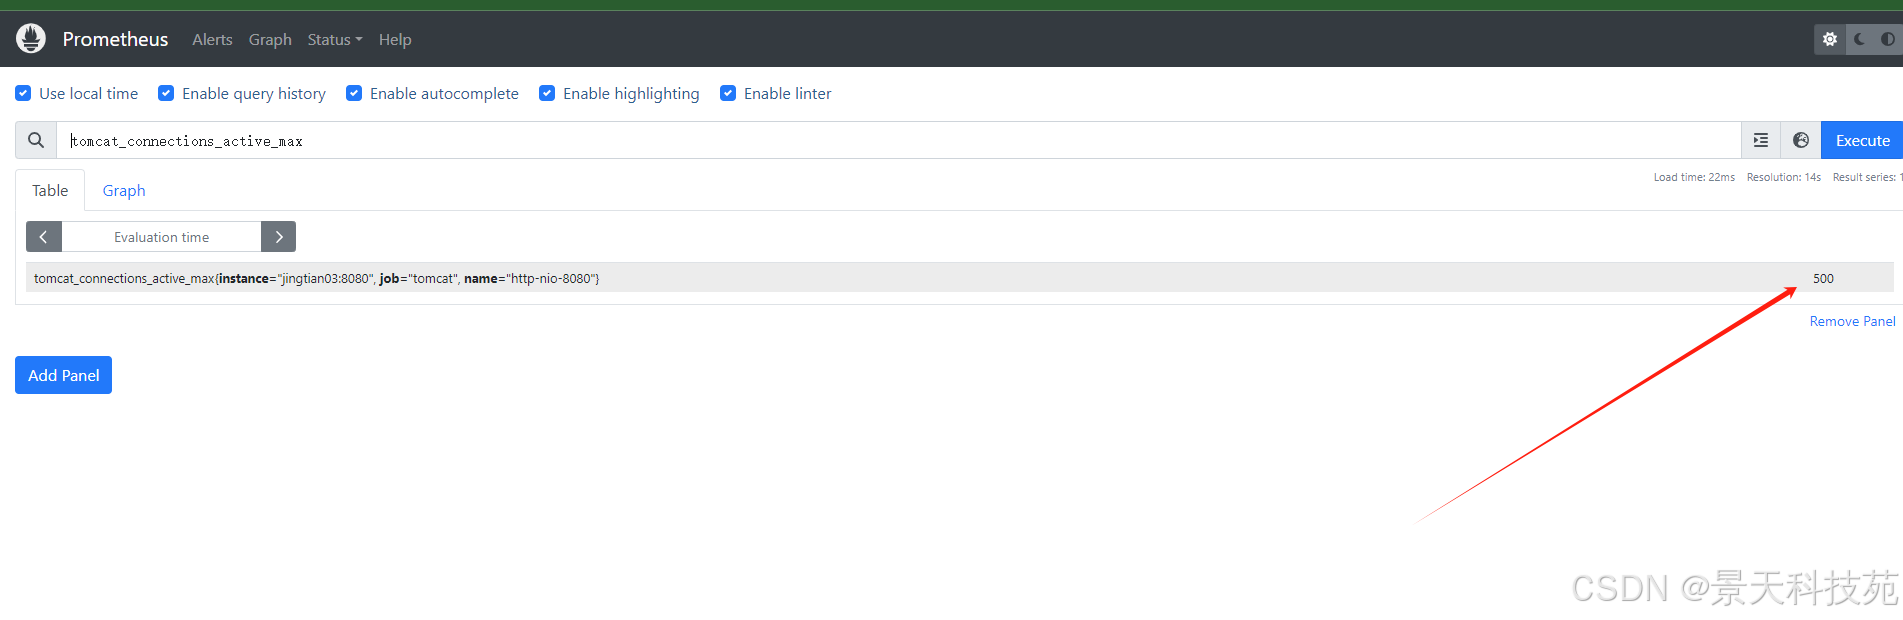
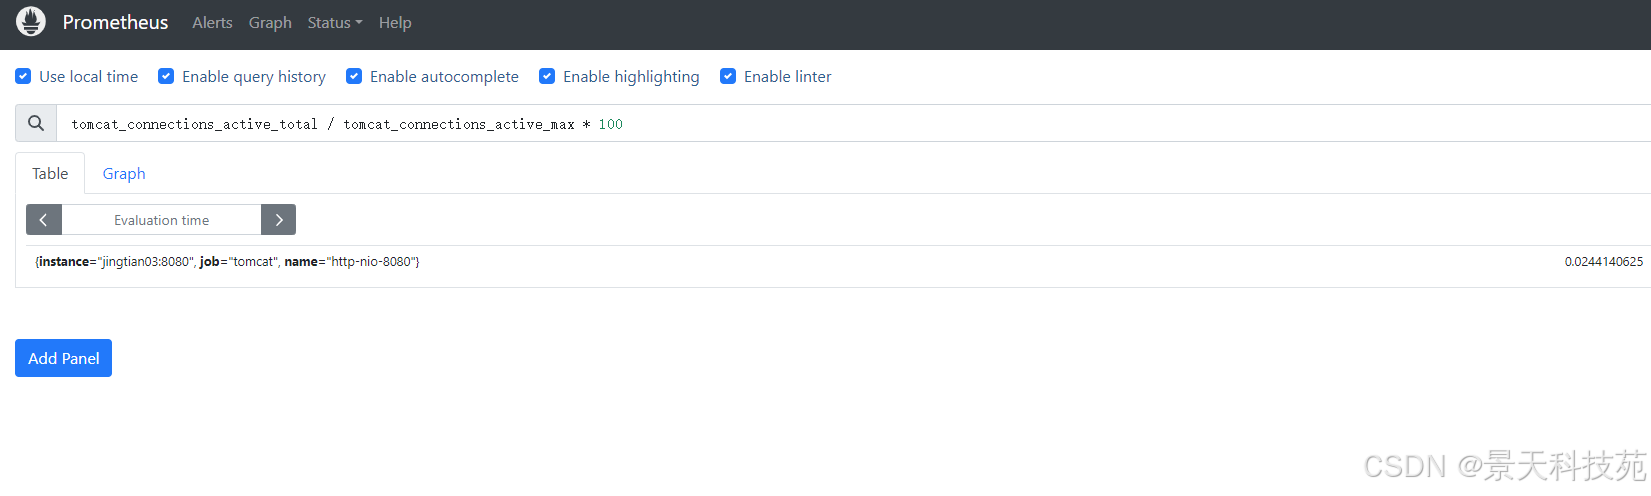
案例:计算tomcat的最大活动连接数的饱和度,计算公式:当前活跃连接数/ 最大活跃连接数 * 100
tomcat_connections_active_total / tomcat_connections_active_max * 100
2. tomcat请求相关指标
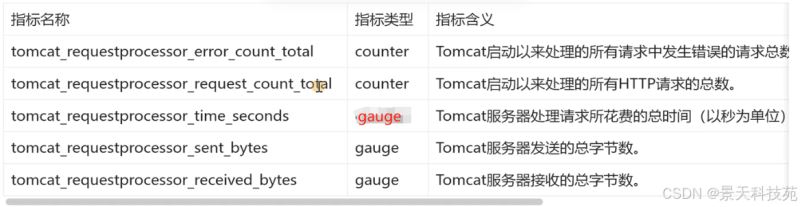
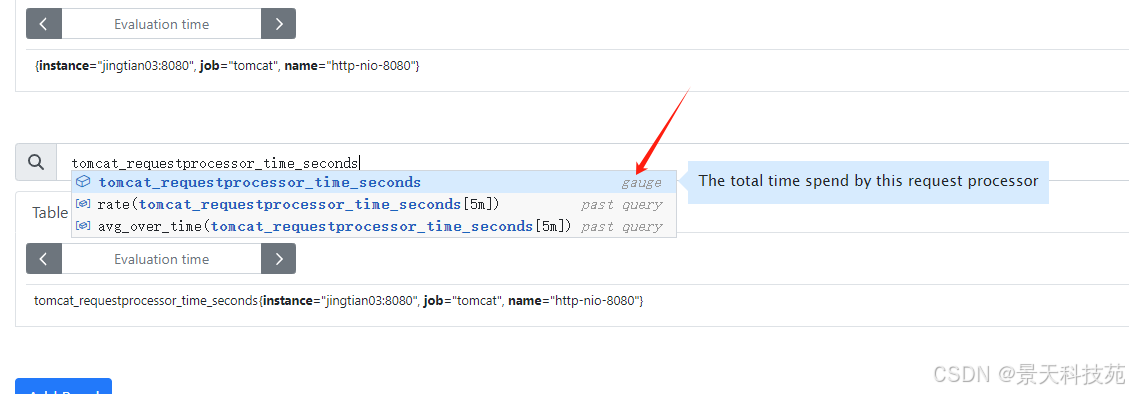
tomcat_requestprocessor_time_seconds tomcat服务器处理请求所花费的总时间(单位是秒)虽然显示是gauge类型指标,但它的值却是不断累加的
案例1:计算tomcat最近5分钟,http请求的错误率占比http请求总数的比率。计算公式: 每5分钟的错误请求数 / 每5分钟的总请求数 * 100
rate(tomcat_requestprocessor_error_count_total[5m]) / rate(tomcat_requestprocessor_request_count_total[5m]) * 100
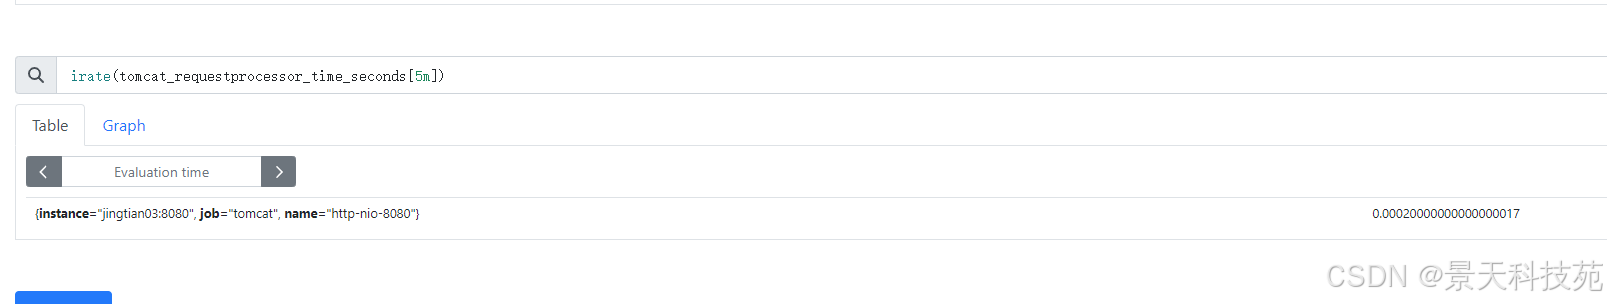
案例2:计算tomcat最近5分钟,处理每个请求所需要花费的时间。
这个本来标注的是gauge类型的数据,但是其值是一直在增大的,因此可以使用irate()来求最近5分钟内,每个请求所花费的时间
irate(tomcat_requestprocessor_time_seconds[5m])
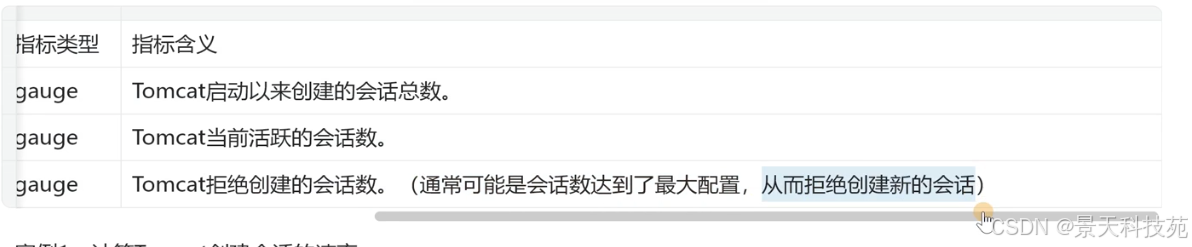
3.tomcat会话相关指标
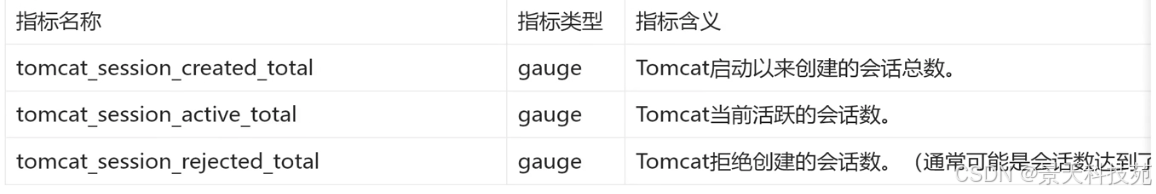
案例1:计算tomcat创建会话的速率。
sum (rate(tomcat_session_created_total[5m])) by (instance,job,host)
案例2:计算被拒绝创建的会话占总创建会话的比率。计算公式:( 拒绝的会话数 / (创建的会话数 + 拒绝会话数) * 100 )
(tomcat_session_rejected_total / ( tomcat_session_created_total + tomcat_session_rejected_total )) * 100
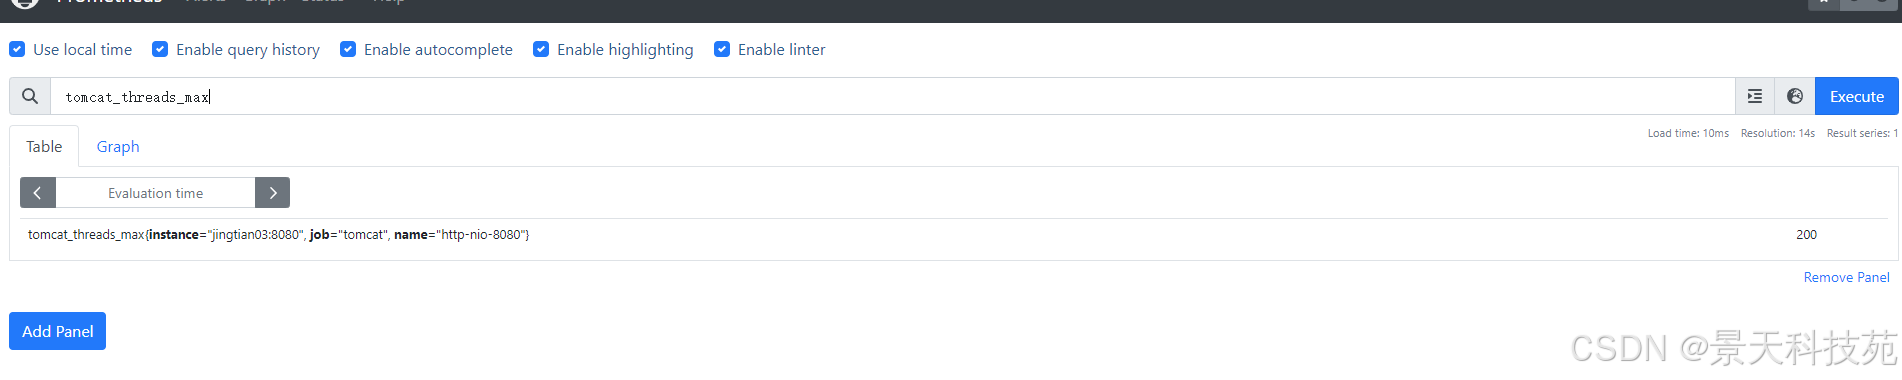
4.tomcat线程相关指标
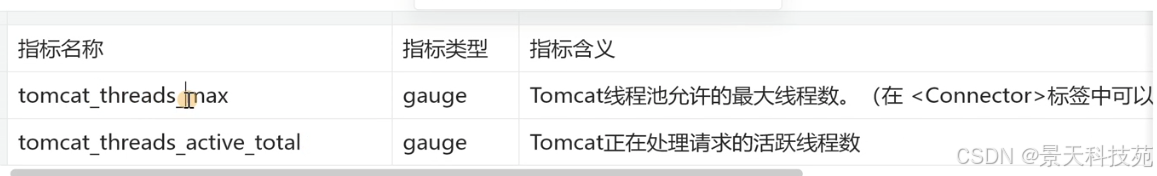
允许的最大线程数,也是可以配置的

默认是200
案例1:计算tomcat活跃的请求线程数占总请求的线程数比率。计算公式:当前活跃线程数 / 最大的线程数 * 100
(tomcat_threads_active_total / tomcat_threads_max) * 100
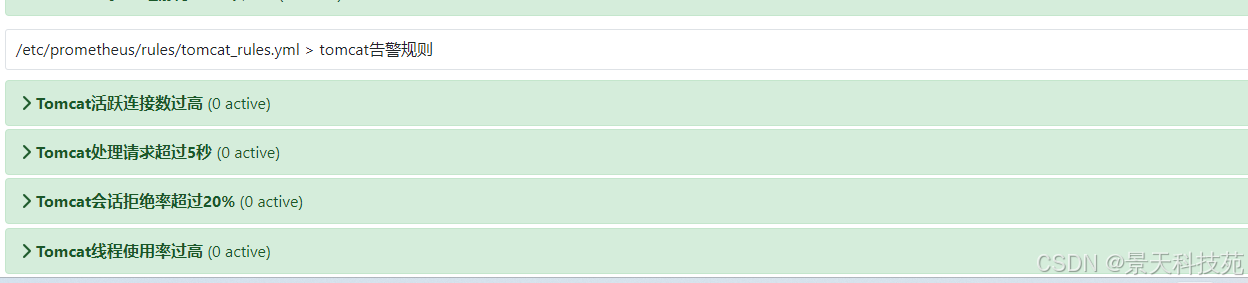
三. tomcat告警规则文件
1、具体告警规则示例文件(可以根据公司实际情况进行调整)
cat /etc/prometheus/rules/tomcat_rules.yml
groups:
- name: tomcat告警规则
  rules:
  - alert: tomcat活跃连接数过高
    expr: tomcat_connections_active_total / tomcat_connections_active_max* 100 >=80
    for: 1m
    labels:
      severity: warning
    annotations:
      summary: "tomcat服务器活跃连接数过高, 实例:{{ $labels.instance }}"
      description:
        tomcat最大连接数是 {{ printf `tomcat_connections_active_max{instance="%s",job="%s",name="%s"}` $labels.instance $labels.job $labels.name | query | first | value }} tomcat目前连接数是 {{ printf `tomcat_connections_active_total{instance="%s",job="%s",name="%s"}` $labels.instance $labels.job $labels.name | query | first | value }} tomcat活跃连接数已超过最大活跃连接数的80%, 当前值为 {{ $value }}%
  - alert: tomcat处理请求超过5秒
    expr: rate(tomcat_requestprocessor_time_seconds[5m]) > 5
    for: 5m
    labels:
      severity: warning
    annotations:
      summary: "tomcat处理请求时间过长, 实例:{{ $labels.instance }}"
      description: "tomcat在过去5分钟的平均处理请求时间超过5秒,当前值 {{ $value}}。"
  - alert: "tomcat会话拒绝率超过20%"
    expr: (tomcat_session_rejected_total / (tomcat_session_created_total +tomcat_session_rejected_total)) * 100 > 20
    for: 5m
    labels:
      severity: critical
    annotations:
      summary: "tomcat会话拒绝率过高, 实例:{{ $labels.instance }}"
      description: "tomcat在host:{{ $labels.host }} 的 {{ $labels.context}} 的上下文中的会话拒绝率超过20%,当前值 {{ $value }}。"

  - alert: "tomcat线程使用率过高"
    expr: (tomcat_threads_active_total / tomcat_threads_max) * 100 > 80
    for: 5m
    labels:
      severity: warning
    annotations:
      summary: "tomcat线程使⽤率过⾼, 实例:{{ $labels.instance }}"
      description: tmcat最大线程数是 {{ printf `tomcat_threads_max{instance="%s",job="%s",name="%s"}` $labels.instance $labels.job $labels.name | query | first| value }} tomcat目前线程数是 {{ printf `tomcat_threads_active_total{instance="%s",job="%s",name="%s"}` $labels.instance $labels.job $labels.name | query | first | value }} tomcat线程数已超过最大活跃连接数的80%, 当前值为 {{ $value }}%
2、验证告警规则
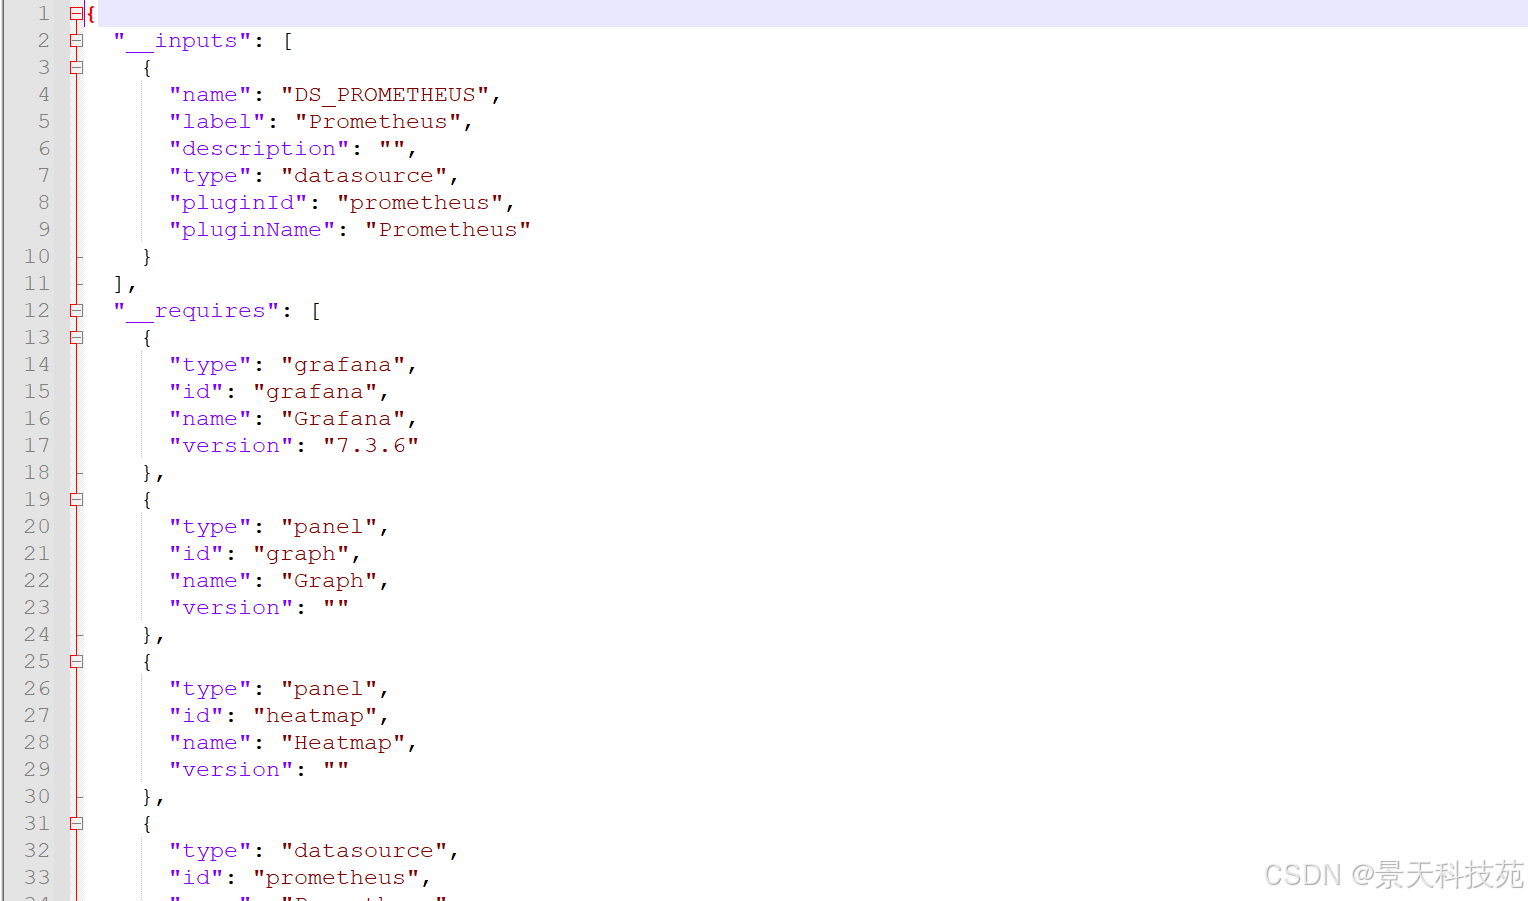
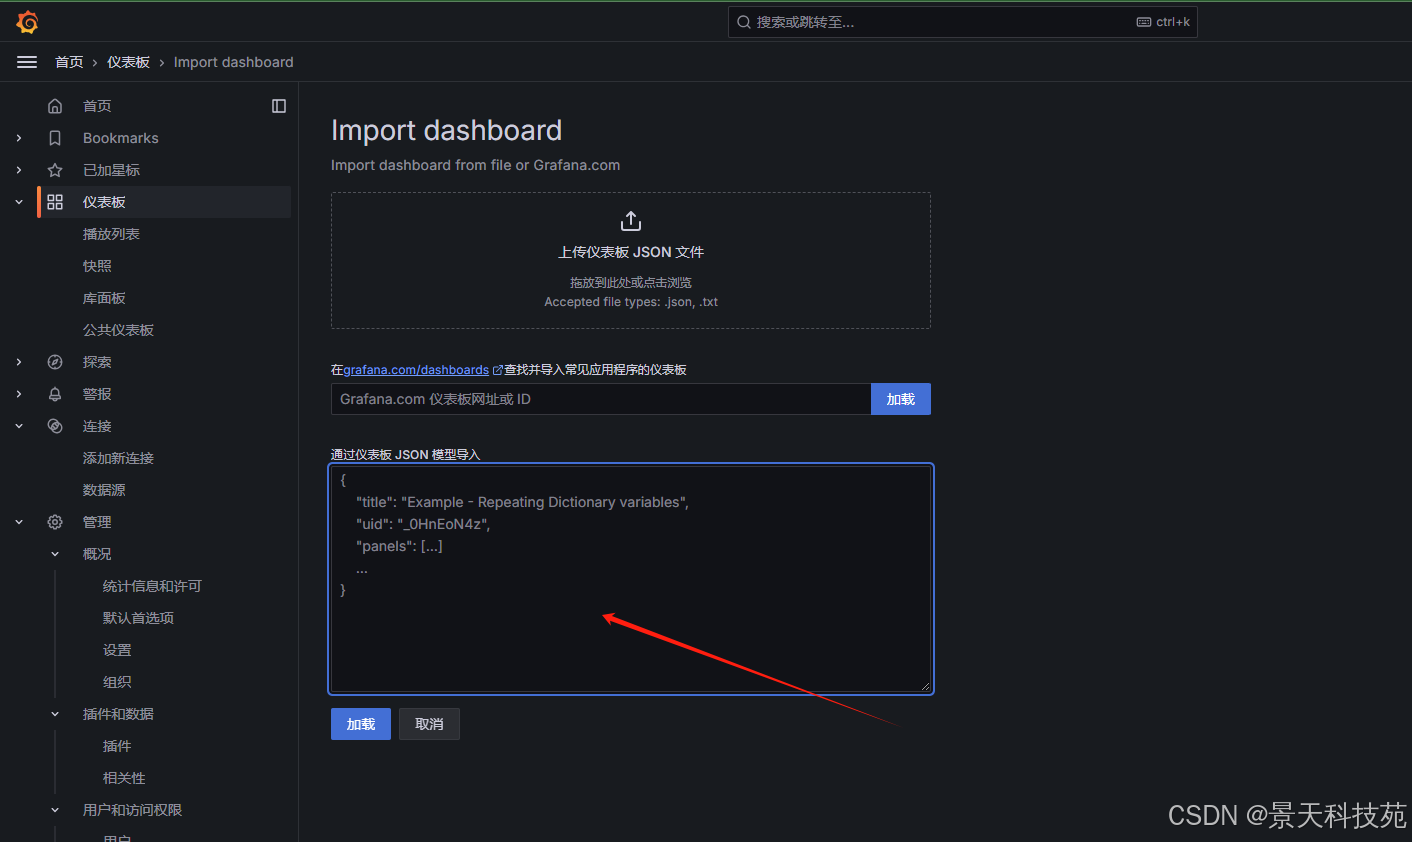
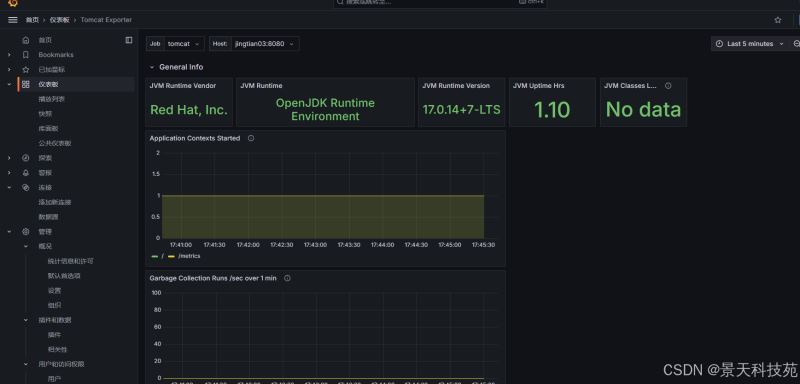
3、导入tomcat图形
1、下载对应的dashboard
https://github.com/nlighten/tomcat_exporter/blob/master/dashboard/example.json
下载下来导入
以上就是通过prometheus监控tomcat运行状态的操作流程的详细内容,更多关于prometheus监控tomcat运行状态的资料请关注代码网其它相关文章!


发表评论