meshgrid函数在二维空间中可以简单地理解为将x轴与y轴的每个位置的坐标关联起来形成了一个网格,我们知道空间中的点是由坐标确定的,因此,当x与y关联起来后,我们便可以给与某个点某个特定值并画出对应的图像。
具体的可以百度一下,会有很多较为详细的介绍。
这里我想要着重的说一下二维以及三维的meshgrid的参数indexing的问题。
二维meshgrid函数
import numpy as np


class debug:
    def __init__(self):
        self.x = np.arange(5)
        self.y = np.arange(5)

    def grid(self):
        x, y = np.meshgrid(self.x, self.y, indexing="xy")
        return x, y


main = debug()
x, y = main.grid()
print("the x grid is:")
print(x)
print("the y grid is:")
print(y)
"""
the x grid is:
[[0 1 2 3 4]
 [0 1 2 3 4]
 [0 1 2 3 4]
 [0 1 2 3 4]
 [0 1 2 3 4]]
the y grid is:
[[0 0 0 0 0]
 [1 1 1 1 1]
 [2 2 2 2 2]
 [3 3 3 3 3]
 [4 4 4 4 4]]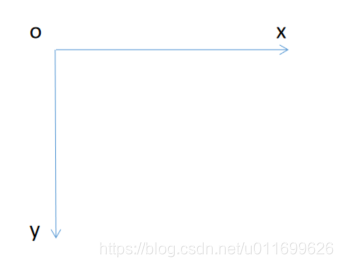
"""从上面的结果可以看出,所获取的网格对应如下图所示,横向为x轴,纵向为y轴,类似于我们在几何空间中使用的坐标系, 我们通常称之为笛卡尔坐标系(cartesian coordinate)。
在二维meshgrid网格创建命令中,笛卡尔坐标系是默认的坐标系。
然而在python编程中,还有一种较为常用的indexing取法,代码如下:
import numpy as np


class debug:
    def __init__(self):
        self.x = np.arange(5)
        self.y = np.arange(5)

    def grid(self):
        x, y = np.meshgrid(self.x, self.y, indexing="ij")
        return x, y


main = debug()
i, j = main.grid()
print("the i grid is:")
print(i)
print("the j grid is:")
print(j)
"""
the i grid is:
[[0 0 0 0 0]
 [1 1 1 1 1]
 [2 2 2 2 2]
 [3 3 3 3 3]
 [4 4 4 4 4]]
the j grid is:
[[0 1 2 3 4]
 [0 1 2 3 4]
 [0 1 2 3 4]
 [0 1 2 3 4]
 [0 1 2 3 4]]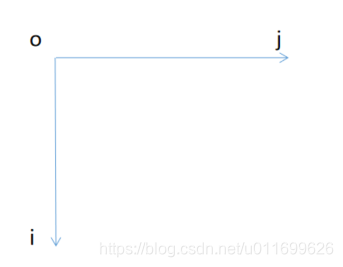
"""此时从上面的结果我们可以看出,所获取的网格对应如下图所示,纵向为i轴,横向为j轴,我们在编程中通常很少使用的这种坐标系。但是它也有自己的优势,这里不进一步说明。
三维meshgrid函数
进一步我们讨论三维的情况,代码如下:
import numpy as np


class debug:
    def __init__(self):
        self.x = np.arange(3)
        self.y = np.arange(3)
        self.z = np.arange(3)

    def grid(self):
        x, y, z = np.meshgrid(self.x, self.y, self.z)
        return x, y, z


main = debug()
x, y, z = main.grid()
print("the x grid is:")
print(x)
print("the y grid is:")
print(y)
print("the z grid is:")
print(z)
"""
the x grid is:
[[[0 0 0]
  [1 1 1]
  [2 2 2]]

 [[0 0 0]
  [1 1 1]
  [2 2 2]]

 [[0 0 0]
  [1 1 1]
  [2 2 2]]]
the y grid is:
[[[0 0 0]
  [0 0 0]
  [0 0 0]]

 [[1 1 1]
  [1 1 1]
  [1 1 1]]

 [[2 2 2]
  [2 2 2]
  [2 2 2]]]
the z grid is:
[[[0 1 2]
  [0 1 2]
  [0 1 2]]

 [[0 1 2]
  [0 1 2]
  [0 1 2]]

 [[0 1 2]
  [0 1 2]
  [0 1 2]]]
"""
由上面的结果我们可以看到,此时的坐标轴对应如下图像:
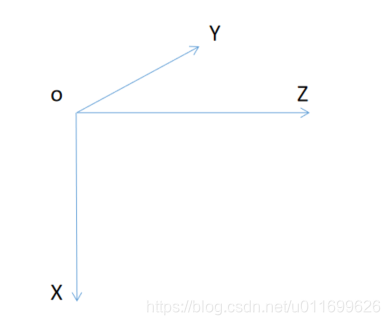
x轴向下,y轴向屏幕内侧,z轴向右侧,在三维图像中不再根据indexing值来区分坐标轴了,而是统一规定了坐标轴的取法,只有对于这个坐标轴的取法深入理解,才能在之后的三维数据处理中游刃有余。
特别说明
但是这里有一个问题,来看一组代码:
class debug:
    def __init__(self):
        x = np.array([[[0],
                       [2]], [[4],
                              [6]], [[8],
                                     [10]]])
        print(x.shape)


main = debug()
"""
(3, 2, 1)
"""我们可以看到,输出结果为(3, 2, 1),即沿着x轴1个元素,沿着y轴2个元素,沿着z轴3个元素。
再来看一下我们使用meshgrid方法生成三维网格的情况。
import numpy as np


class debug:
    def __init__(self):
        self.x = np.arange(1)
        self.y = np.arange(2)
        self.z = np.arange(3)

    def grid(self):
        x, y, z = np.meshgrid(self.x, self.y, self.z)
        return x, y, z


main = debug()
x, y, z = main.grid()
print("the x grid is:")
print(x.shape)
print("the y grid is:")
print(y.shape)
print("the z grid is:")
print(z.shape)
"""
the x grid is:
(2, 1, 3)
the y grid is:
(2, 1, 3)
the z grid is:
(2, 1, 3)
"""我们可以看到,最终输出的x,y,z的shape均为(2, 1, 3),这对应的是沿着x轴3个元素,沿着y轴1个元素,沿着z轴2个元素。
突然感觉有些混乱,不符合我们之前想要得到的x,y,z的排列顺序,为了能够得到正常的排列顺序,我们可以使用如下代码:
import numpy as np


class debug:
    def __init__(self):
        self.x = np.arange(1)
        self.y = np.arange(2)
        self.z = np.arange(3)

    def grid(self):
        x, y, z = np.meshgrid(self.y, self.z, self.x)
        return x, y, z


main = debug()
x, y, z = main.grid()
print("the x grid is:")
print(x.shape)
print("the y grid is:")
print(y.shape)
print("the z grid is:")
print(z.shape)
"""
the x grid is:
(3, 2, 1)
the y grid is:
(3, 2, 1)
the z grid is:
(3, 2, 1)
"""可以看到运行后我们得到了符合python默认坐标轴习惯的网格形式,这时对应的x轴向右侧,y轴向下,z轴向屏幕里面。
这个仅仅是为了理解需要,实际操作中无需进行这种坐标轴变换操作,直接使用默认的三维坐标轴方向即可。
总结
以上为个人经验,希望能给大家一个参考,也希望大家多多支持代码网。


发表评论