当我们绘制复杂的图表,尤其是包含多个数据系列的图表时,一个清晰、易读的图例是至关重要的。plt.legend()函数是matplotlib库中用于添加和定制图例的关键工具。在本篇博文中,我们将深入探讨plt.legend()的功能、用法以及如何通过它提升图表的可读性和美观度。
1.plt.legend()的基本用法
首先,我们需要了解plt.legend()的基本用法。通常,在绘制完图表的数据系列后,我们可以简单地调用plt.legend()来自动创建一个图例。例如:
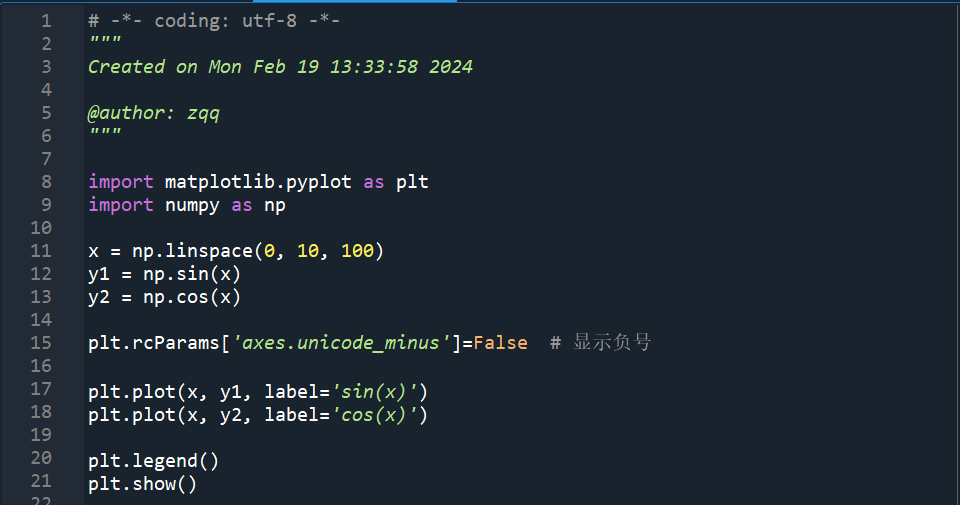
# -*- coding: utf-8 -*-
"""
created on mon feb 19 13:33:58 2024

@author: zqq
"""

import matplotlib.pyplot as plt
import numpy as np

x = np.linspace(0, 10, 100)
y1 = np.sin(x)
y2 = np.cos(x)

plt.rcparams['axes.unicode_minus']=false  # 显示负号

plt.plot(x, y1, label='sin(x)')
plt.plot(x, y2, label='cos(x)')

plt.legend()
plt.show()
在这个例子中,label参数用于为数据系列指定标签,这些标签随后被plt.legend()用来创建图例。
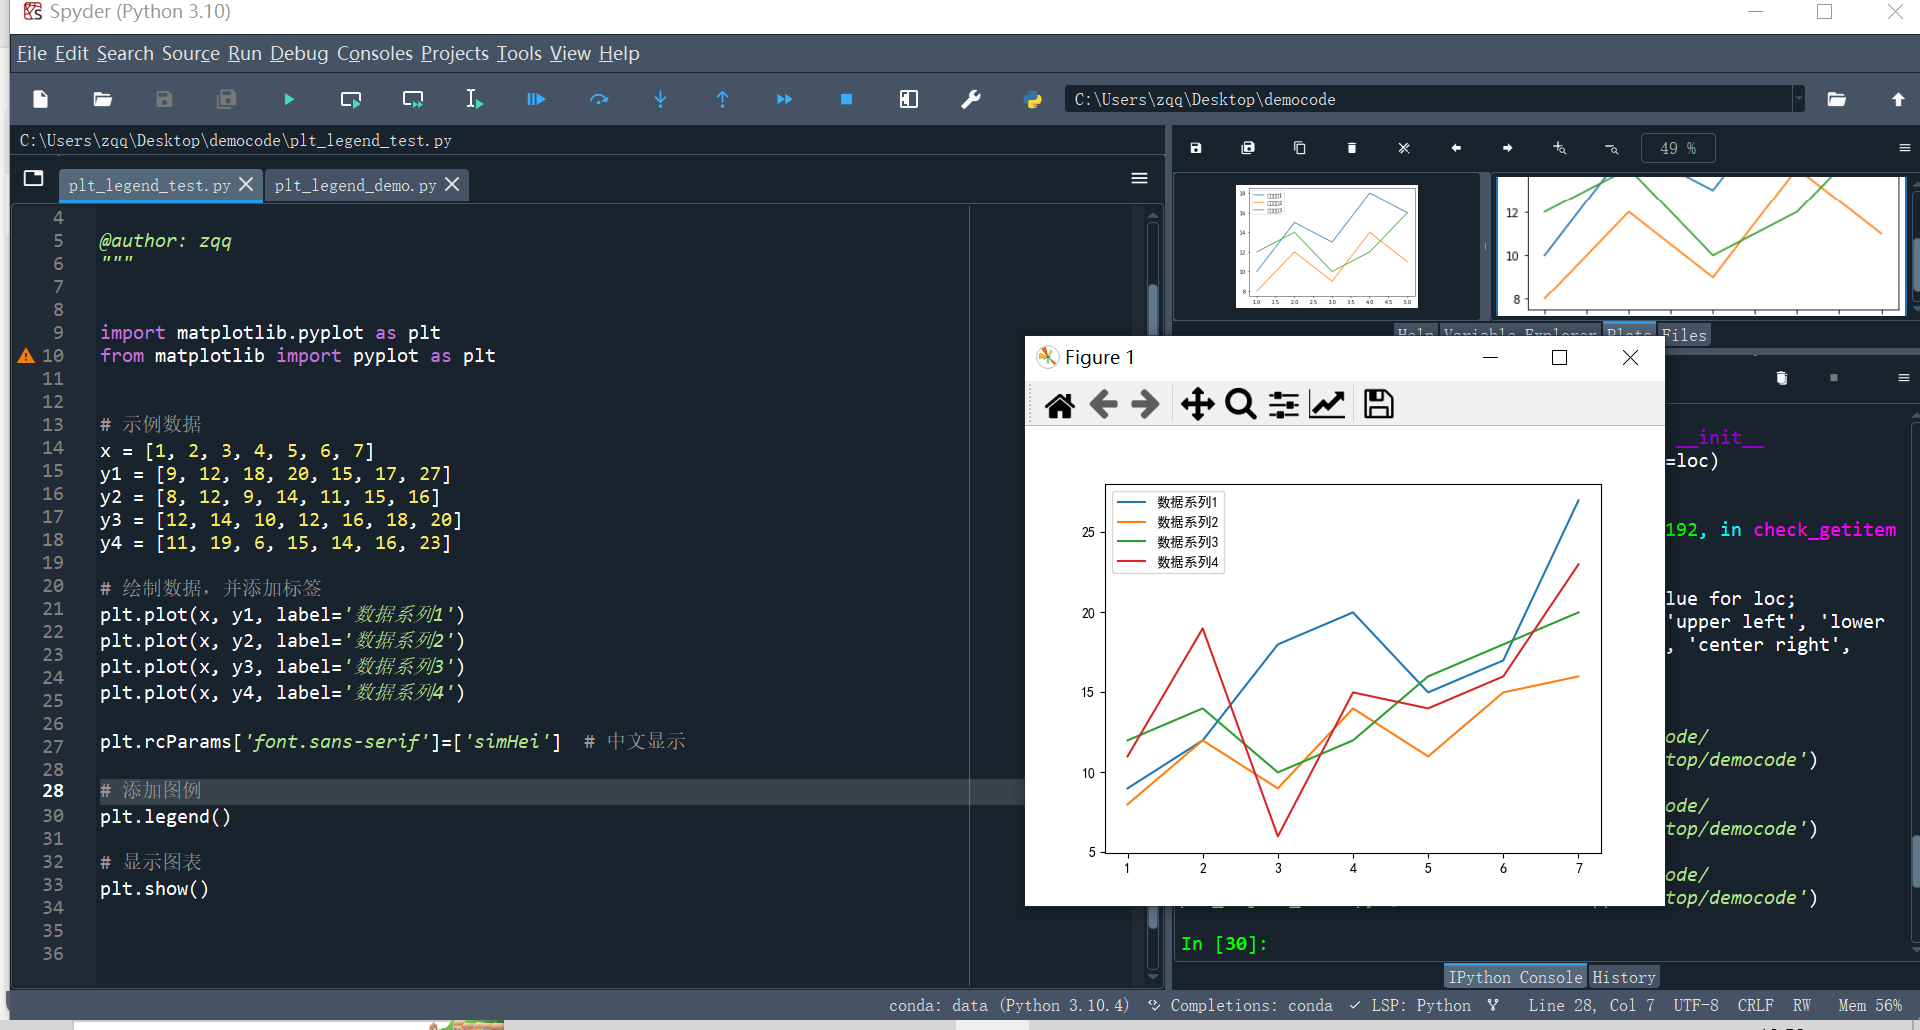
这段代码在spyder编辑器中如下:
运行代码,得到下面的图表:
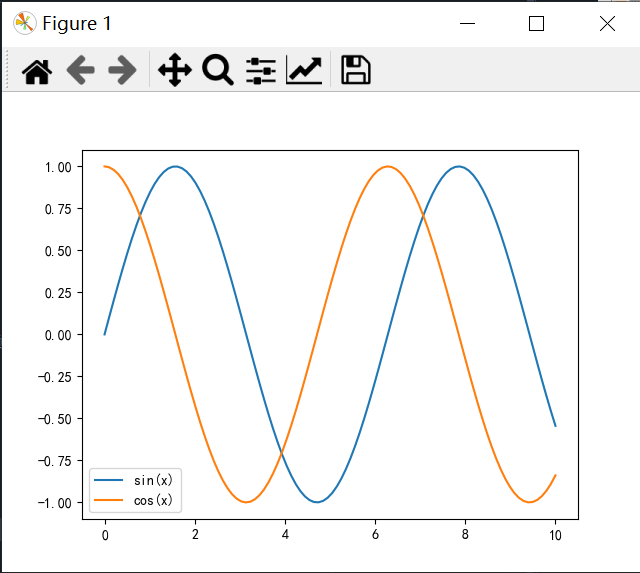
可以看到图例(蓝色实线sin(x)、橙色实线cos(x))在左下角,我们可以通过设置超参数指定该图例的位置。plt.rcparams[‘axes.unicode_minus’]=false # 显示负号,这段代码表示正常显示负号。
使用方法:
plt.legend(loc='xxx')
xxx的取值为:
- ‘best’(默认值):自动选择最佳位置。
- ‘upper right’:右上角。
- ‘upper left’:左上角。
- ‘lower right’:右下角。
- ‘lower left’:左下角。
- ‘right’:右侧。
- ‘center left’:左侧中央。
- ‘center right’:右侧中央。
- ‘lower center’:底部中央。
- ‘upper center’:顶部中央。
2.plt.legend()的示例
# -*- coding: utf-8 -*-
"""
created on mon feb 19 11:21:04 2024
@author: zqq
"""
import matplotlib.pyplot as plt
from matplotlib import pyplot as plt
# 示例数据
x = [1, 2, 3, 4, 5, 6, 7]
y1 = [9, 12, 18, 20, 15, 17, 27]
y2 = [8, 12, 9, 14, 11, 15, 16]
y3 = [12, 14, 10, 12, 16, 18, 20]
y4 = [11, 19, 6, 15, 14, 16, 23]
# 绘制数据,并添加标签
plt.plot(x, y1, label='数据系列1')
plt.plot(x, y2, label='数据系列2')
plt.plot(x, y3, label='数据系列3')
plt.plot(x, y4, label='数据系列4')
plt.rcparams['font.sans-serif']=['simhei'] # 中文显示
# 添加图例
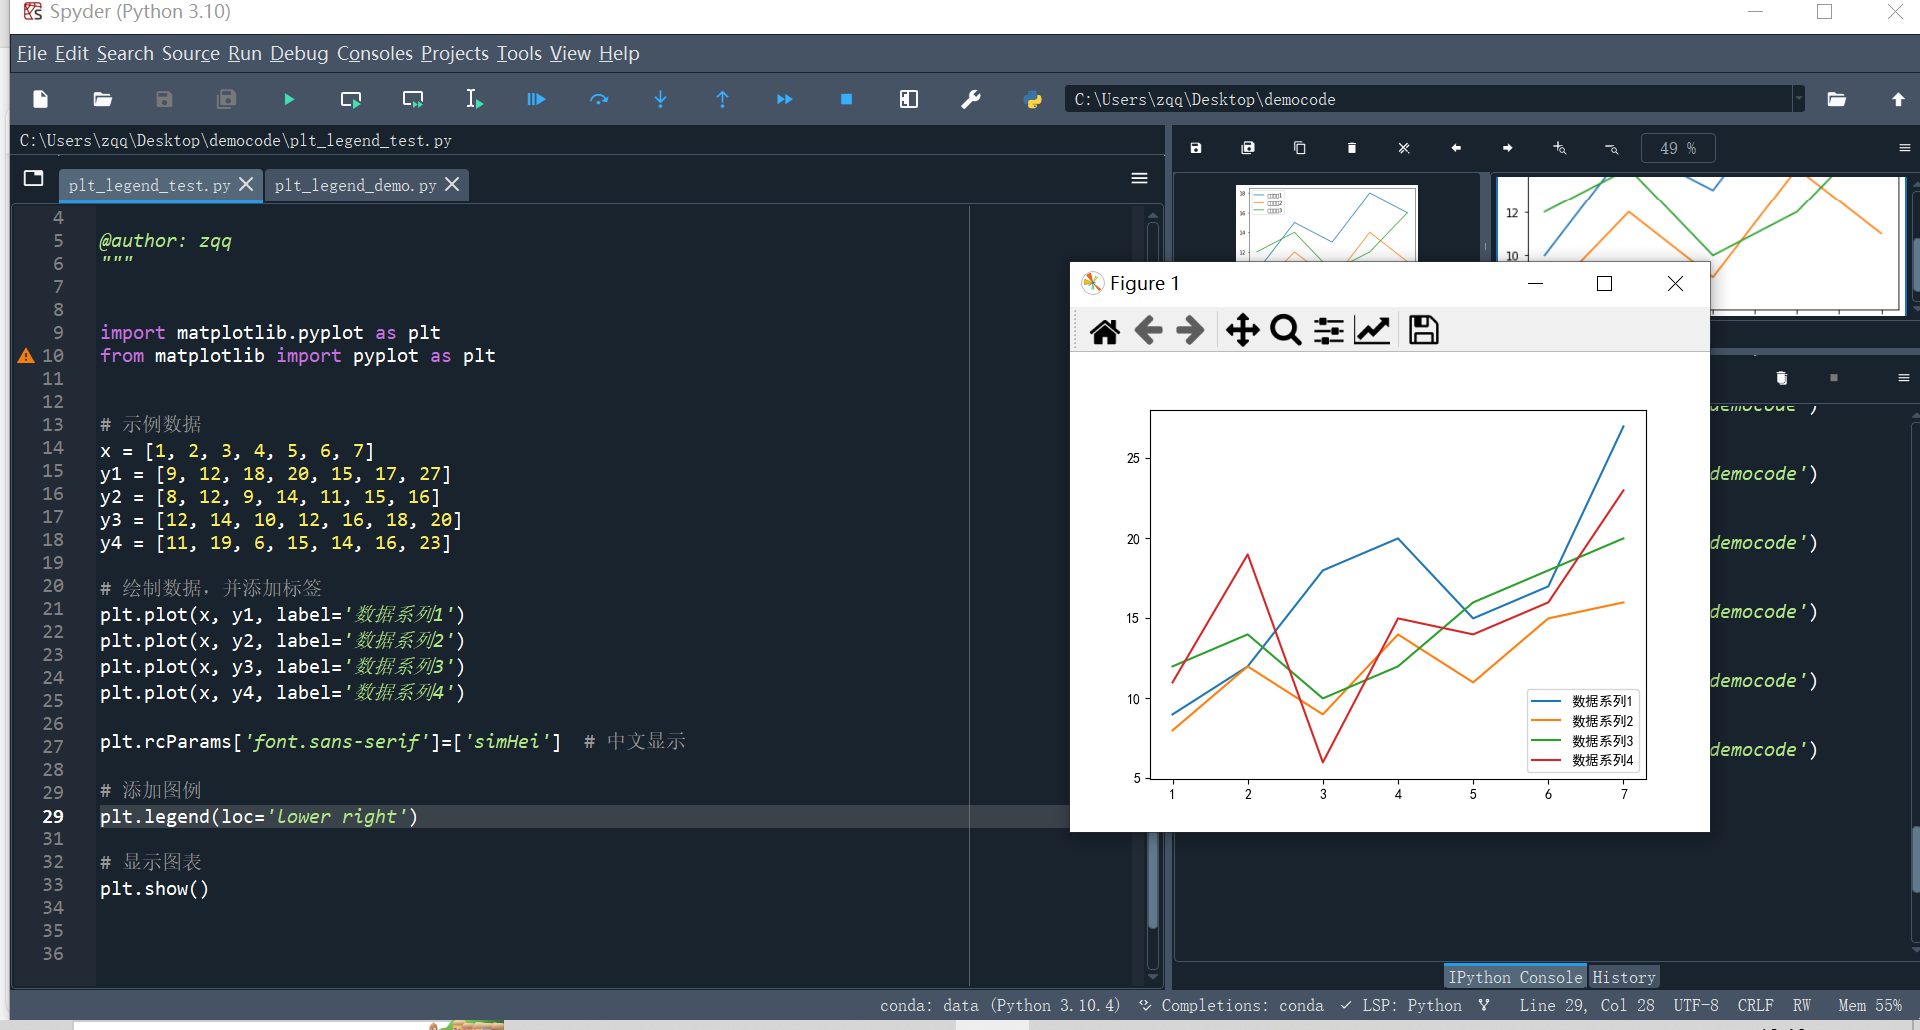
plt.legend(loc='lower right')
# 显示图表
plt.show()
plt.rcparams[‘font.sans-serif’]=[‘simhei’] # 中文显示,这段代码表示正常显示中文。
plt.legend(loc=‘lower right’),显示在右下角:
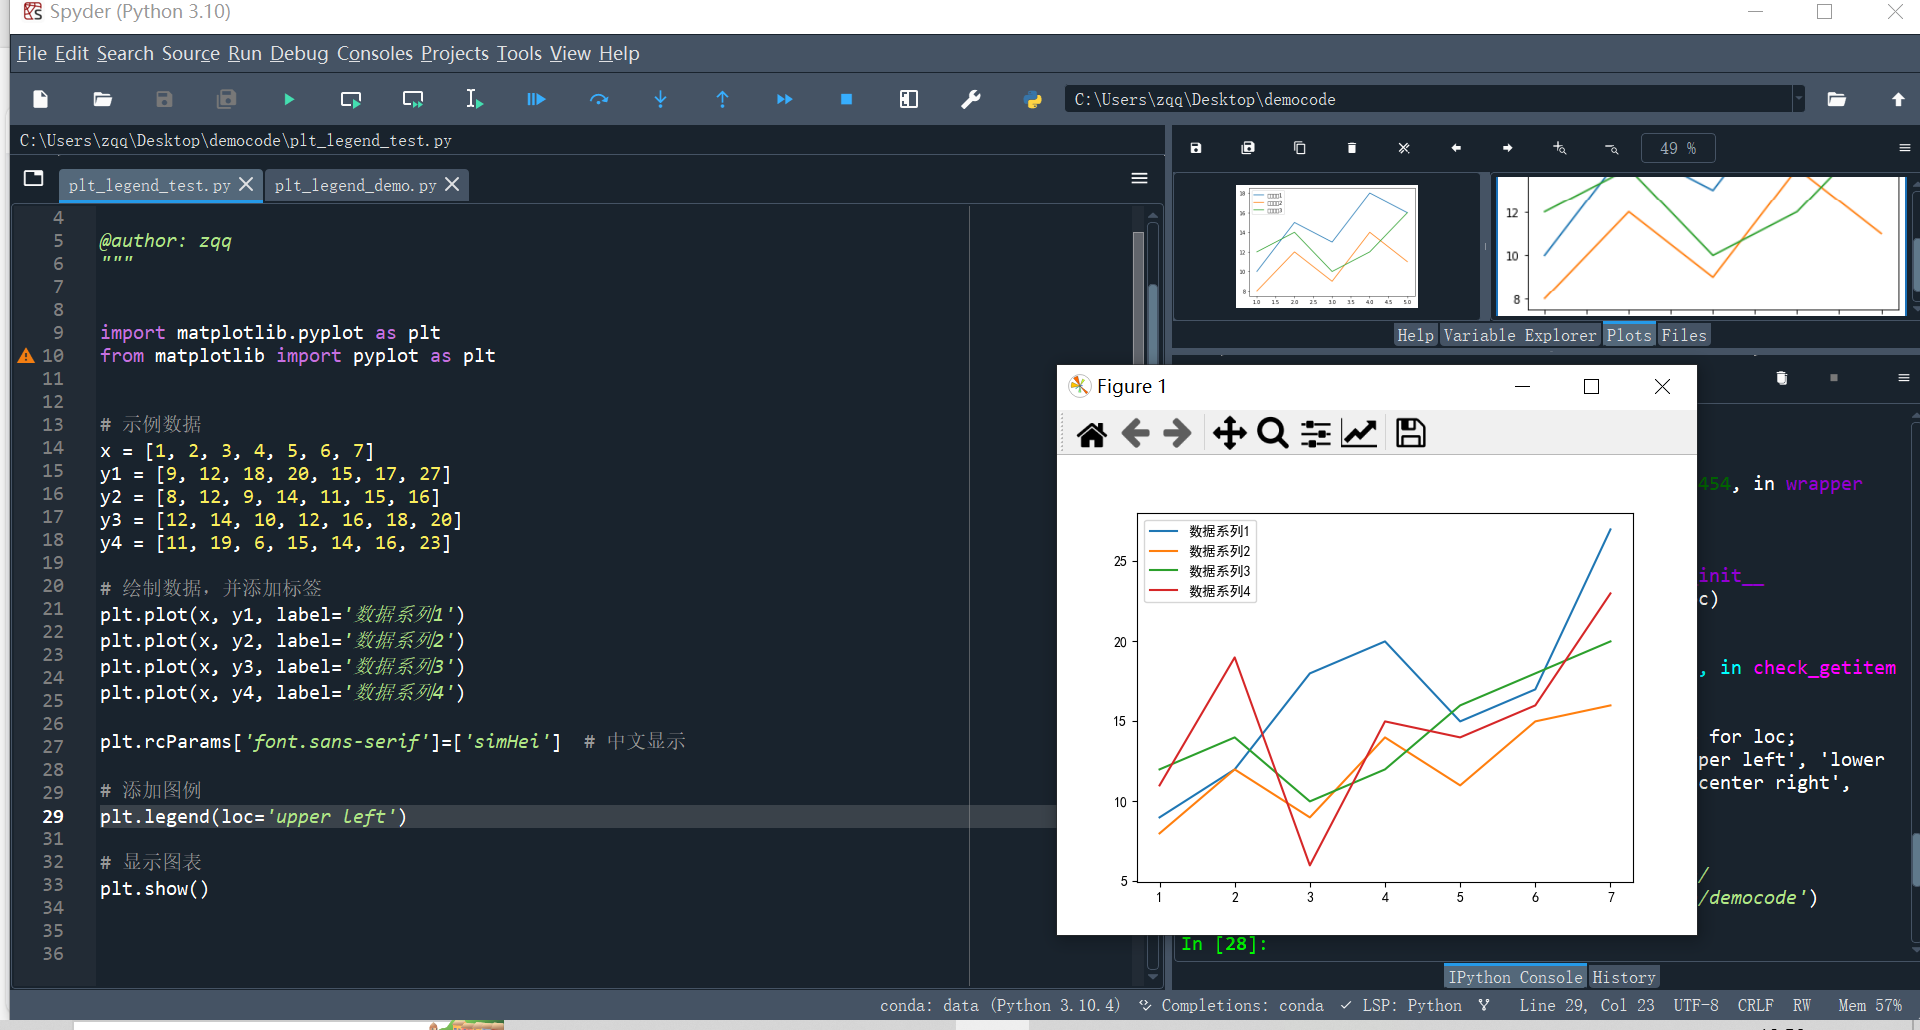
plt.legend(loc=‘upper left’),显示在左上角:
# -*- coding: utf-8 -*-
"""
created on mon feb 19 11:21:04 2024

@author: zqq
"""


import matplotlib.pyplot as plt
from matplotlib import pyplot as plt


# 示例数据
x = [1, 2, 3, 4, 5, 6, 7]
y1 = [9, 12, 18, 20, 15, 17, 27]
y2 = [8, 12, 9, 14, 11, 15, 16]
y3 = [12, 14, 10, 12, 16, 18, 20]
y4 = [11, 19, 6, 15, 14, 16, 23]

# 绘制数据,并添加标签
plt.plot(x, y1, label='数据系列1')
plt.plot(x, y2, label='数据系列2')
plt.plot(x, y3, label='数据系列3')
plt.plot(x, y4, label='数据系列4')

plt.rcparams['font.sans-serif']=['simhei']  # 中文显示

# 添加图例
plt.legend(loc='upper left')

# 显示图表
plt.show()
plt.legend(),默认参数,显示在最佳位置:
# -*- coding: utf-8 -*-
"""
created on mon feb 19 11:21:04 2024

@author: zqq
"""


import matplotlib.pyplot as plt
from matplotlib import pyplot as plt


# 示例数据
x = [1, 2, 3, 4, 5, 6, 7]
y1 = [9, 12, 18, 20, 15, 17, 27]
y2 = [8, 12, 9, 14, 11, 15, 16]
y3 = [12, 14, 10, 12, 16, 18, 20]
y4 = [11, 19, 6, 15, 14, 16, 23]

# 绘制数据,并添加标签
plt.plot(x, y1, label='数据系列1')
plt.plot(x, y2, label='数据系列2')
plt.plot(x, y3, label='数据系列3')
plt.plot(x, y4, label='数据系列4')

plt.rcparams['font.sans-serif']=['simhei']  # 中文显示

# 添加图例
plt.legend()

# 显示图表
plt.show()
图例不仅是数据系列的标识,它也是图表整体设计的一部分。合适的图例位置、大小和样式可以极大地提高图表的可读性和吸引力。在设计图表时,考虑图例与其他图表元素(如标题、轴标签、刻度等)的协调性和一致性非常重要。plt.legend()是matplotlib中不可或缺的一个函数,它使得我们能够轻松地为图表添加清晰、美观的图例。通过了解其基本用法和定制选项,你可以创建出既信息丰富又视觉上吸引人的图表。不断实践和探索,你将发现plt.legend()为你的数据可视化工作带来的无限可能。
这是2024年的第一篇博文,本来想写更好的内容,但是工作是越来越卷了,根本没有时间撰写更优质的博文,已经断更挺长时间了。借着今天修改代码中的图例,挤出时间写成文章,实属不易,干货不多,还望各位海涵。后面将继续更新专栏文章,回馈广大粉丝朋友。
好了,今天的学习就到这里,让我们下期再见。
参考:
https://blog.csdn.net/weixin_74850661/article/details/132949071


发表评论