1、在虚拟机中安装docker、docker-compose
1.1、安装docker
1.1.1、清除旧版本的docker
yum remove docker docker-client docker-client-latest docker-common docker-latest docker-latest-logrotate docker-logrotate docker-engine1.1.2、安装docker的依赖
yum install -y yum-utils device-mapper-persistent-data lvm21.1.3、安装gcc
yum install -y gcc gcc-c++1.1.4、添加软件源国内镜像
yum-config-manager --add-repo http://mirrors.aliyun.com/docker-ce/linux/centos/docker-ce.repo1.1.5、更新yum索引
yum makecache1.1.6、安装docker-ce
yum install docker-ce docker-ce-cli containerd.io1.1.7、启动docker,并设置开机启动
-- 启动docker
systemctl start docker
-- 设置docker开机启动
systemctl enable docker
1.1.8、验证docker的安装是否成功
docker version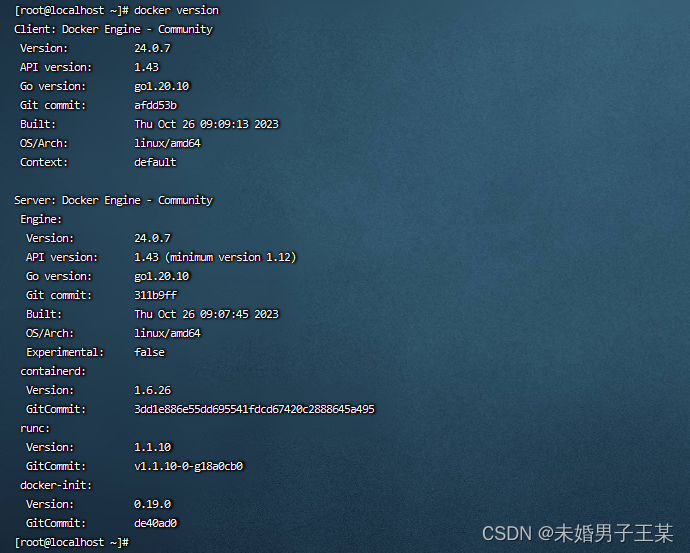
1.2、安装docker-compose
1.2.1、docker和docker-compose的兼容性
1.2.2、下载docker-compose的二进制文件
方式一:
curl -l https://github.com/docker/compose/releases/download/v2.21.0/docker-compose-'uname -s'-'uname -m' -o /usr/local/bin/docker-compose方式二(推荐):
直接在github上下载,将其迁移到/usr/local/bin目录下,并授予读写权限。
url:https://github.com/docker/compose/releases
chmod -r 777 /usr/local/bin/docker-compose注意:此处尽可能选择在github上获取,国内的地址后期出现问题的几率较大,一次不成功多试几次。
1.2.3、验证docker-compose的安装是否成功
docker compose version2、安装apisix
2.1、下载 apisix-docker仓库
git clone https://github.com/apache/apisix-docker.git2.2、进入拉取的目录中
cd apisix-docker/example2.3、修改docker-compose文件的内容
#
# licensed to the apache software foundation (asf) under one or more
# contributor license agreements.  see the notice file distributed with
# this work for additional information regarding copyright ownership.
# the asf licenses this file to you under the apache license, version 2.0
# (the "license"); you may not use this file except in compliance with
# the license.  you may obtain a copy of the license at
#
#     http://www.apache.org/licenses/license-2.0
#
# unless required by applicable law or agreed to in writing, software
# distributed under the license is distributed on an "as is" basis,
# without warranties or conditions of any kind, either express or implied.
# see the license for the specific language governing permissions and
# limitations under the license.
#

version: "3"

services:
  apisix:
    image: apache/apisix:${apisix_image_tag:-3.7.0-debian}
    restart: always
    volumes:
      - ./apisix_conf/config.yaml:/usr/local/apisix/conf/config.yaml:ro
    depends_on:
      - etcd
    ##network_mode: host
    ports:
      - "9180:9180/tcp"
      - "9080:9080/tcp"
      - "9091:9091/tcp"
      - "9443:9443/tcp"
      - "9092:9092/tcp"
    networks:
      apisix:

  etcd:
    image: bitnami/etcd:3.4.15
    restart: always
    volumes:
      - etcd_data:/bitnami/etcd
    environment:
      etcd_enable_v2: "true"
      allow_none_authentication: "yes"
      etcd_advertise_client_urls: "http://yourip:2379"
      etcd_listen_client_urls: "http://0.0.0.0:2379"
    ports:
      - "2379:2379/tcp"
    networks:
      apisix:

  web1:
    image: nginx:1.19.0-alpine
    restart: always
    volumes:
      - ./upstream/web1.conf:/etc/nginx/nginx.conf
    ports:
      - "9081:80/tcp"
    environment:
      - nginx_port=80
    networks:
      apisix:

  web2:
    image: nginx:1.19.0-alpine
    restart: always
    volumes:
      - ./upstream/web2.conf:/etc/nginx/nginx.conf
    ports:
      - "9082:80/tcp"
    environment:
      - nginx_port=80
    networks:
      apisix:

  prometheus:
    image: prom/prometheus:v2.25.0
    restart: always
    volumes:
      - ./prometheus_conf/prometheus.yml:/etc/prometheus/prometheus.yml
    ports:
      - "9090:9090"
    networks:
      apisix:

  grafana:
    image: grafana/grafana:7.3.7
    restart: always
    ports:
      - "3000:3000"
    volumes:
      - "./grafana_conf/provisioning:/etc/grafana/provisioning"
      - "./grafana_conf/dashboards:/var/lib/grafana/dashboards"
      - "./grafana_conf/config/grafana.ini:/etc/grafana/grafana.ini"
    networks:
      apisix:

networks:
  apisix:
    driver: bridge

volumes:
  etcd_data:
    driver: local
该文件中主要修改下图中的位置
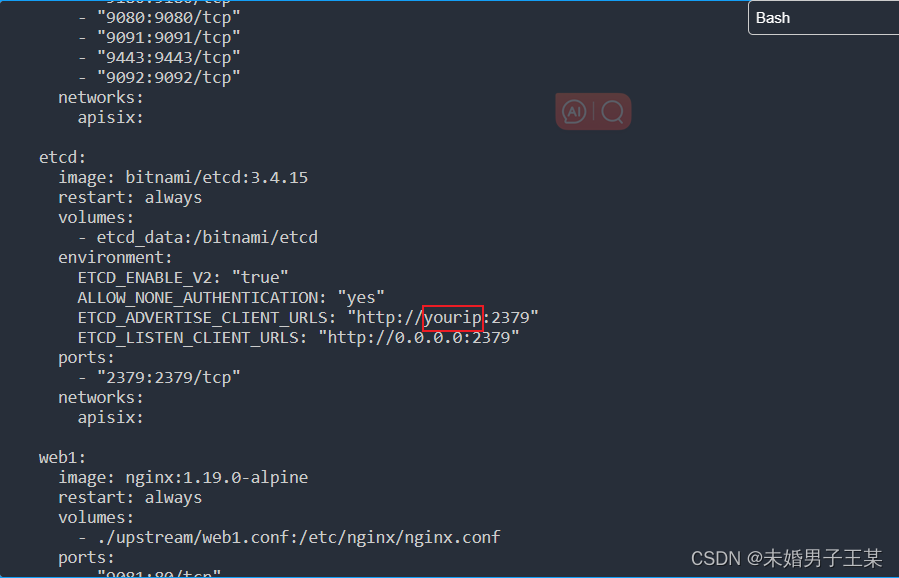
2.4、使用docker-compose启用 apisix
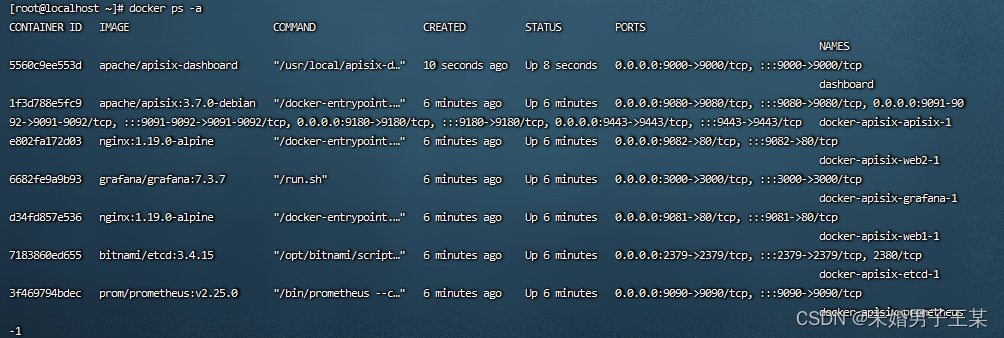
docker-compose -p docker-apisix up -d2.5、查看apisix安装的情况
docker ps -a此处关注的点是观察全部容器是否为up状态。
3、安装apisix-dashboard
3.1、拉取apisix-dashboard镜像
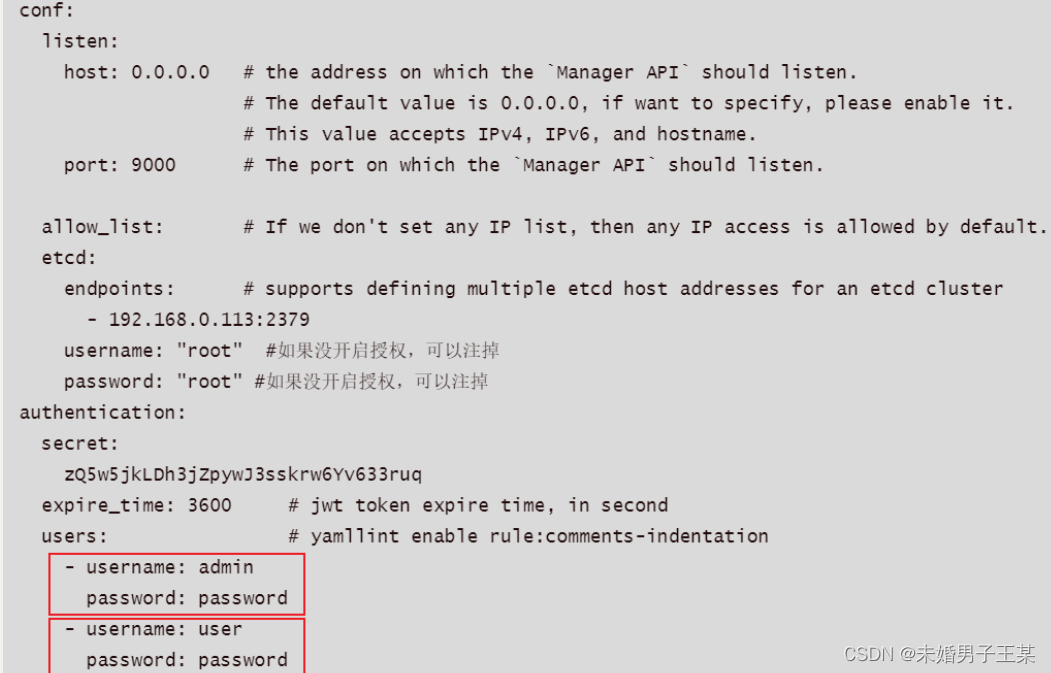
docker pull apache/apisix-dashboard3.2、添加dashboard的配置文件在/root路径下,conf.yaml
conf:
  listen:
    host: 0.0.0.0   # the address on which the `manager api` should listen.
                    # the default value is 0.0.0.0, if want to specify, please enable it.
                    # this value accepts ipv4, ipv6, and hostname.
    port: 9000      # the port on which the `manager api` should listen.

  allow_list:       # if we don't set any ip list, then any ip access is allowed by default.
  etcd:
    endpoints:      # supports defining multiple etcd host addresses for an etcd cluster
      - yourip:2379 # etcd install ip
authentication:
  secret:
    zq5w5jkldh3jzpywj3sskrw6yv633ruq
  expire_time: 3600     # jwt token expire time, in second
  users:                # yamllint enable rule:comments-indentation
    - username: admin       # dashboard login infomation
      password: password
    - username: user
      password: password
3.3、启动容器
docker run -d --name dashboard -p 9000:9000 -v <config_file>:/usr/local/apisix-dashboard/conf/conf.yaml apache/apisix-dashboard
-d:在后台运行
--name:设置镜像名称
-p:端口号
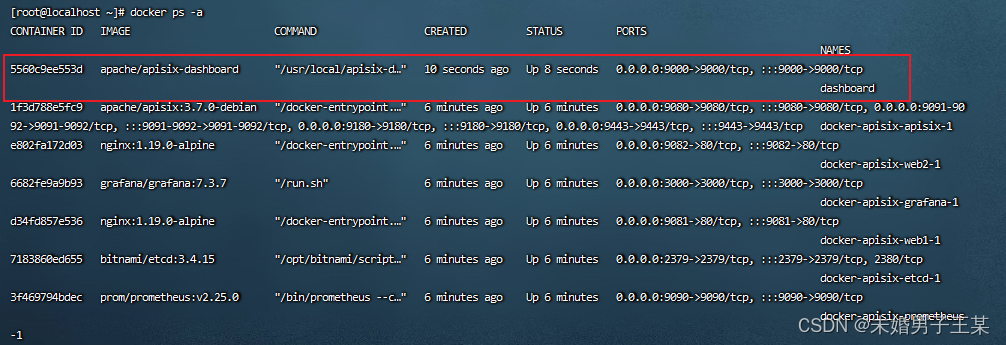
-v:配置信息的挂载3.4、查看容器启动情况
4、测试
4.1、访问http://yourip:9000,可以访问到dashboard的页面,账号密码在conf.yaml文件中
4.2、访问http://yourip:3000,可以访问到grafana的页面,账号密码均为admin,需要输入两次
4.3、访问http://yourip:9090,可以访问到prometheus页面
至此apisix和apisix-dashboard安装完成。


发表评论