1.kmeans聚类算法简介
kmeans聚类算法是一种迭代求解的聚类分析算法。其实现步骤如下:
(1) 随机选取k个对象作为初始的聚类中心
(2) 计算每个对象与各个种子聚类中心之间的距离,把每个对象分配给距离它最近的聚类中心。
(3) 聚类中心以及分配给它们的对象就代表一个聚类。每分配一个样本,聚类的聚类中心会根据聚类中现有的对象被重新计算。
(4) 重复步骤(2)、(3),直到满足某个终止条件。终止条件可以是聚类中心再发生变化或者误差平方和局部最小等。
2.kmeans聚类算法的代码实现
(1) 首先,加载需要进行分类的数据集。
data(:,1)=[90,35,52,83,64,24,49,92,99,45,19,38,1,71,56,97,63,...
32,3,34,33,55,75,84,53,15,88,66,41,51,39,78,67,65,25,40,77,...
13,69,29,14,54,87,47,44,58,8,68,81,31];
data(:,2)=[33,71,62,34,49,48,46,69,56,59,28,14,55,41,39,...
78,23,99,68,30,87,85,43,88,2,47,50,77,22,76,94,11,80,...
51,6,7,72,36,90,96,44,61,70,60,75,74,63,40,81,4];
figure(1)
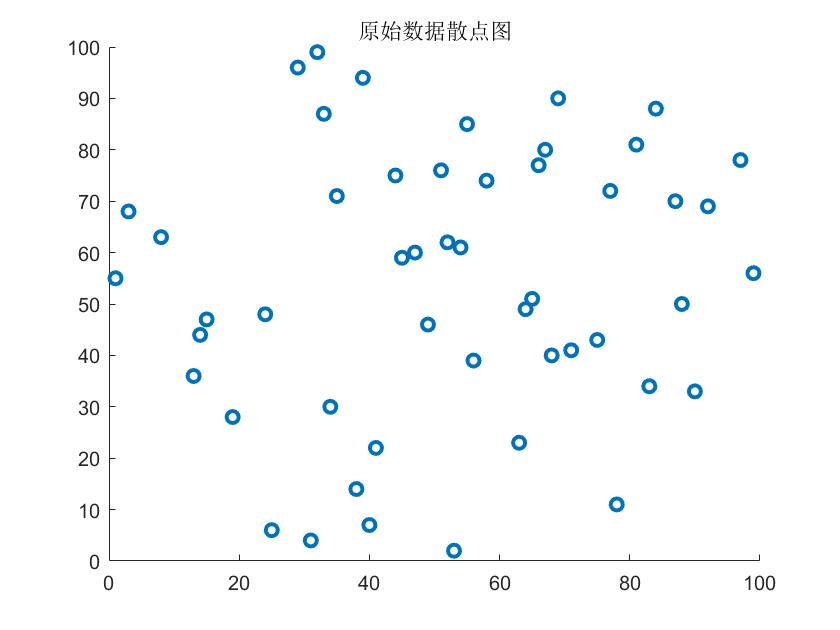
scatter(data(:,1),data(:,2),'linewidth',2)
title("原始数据散点图")原始数据绘制散点图如下所示:
(2) 设置分类数量并调用自己编写的kmeans聚类函数
cluster_num=4;
[index_cluster,cluster] = kmeans_func(data,cluster_num);
function [index_cluster,cluster] = kmeans_func(data,cluster_num)
%% 原理推导kmeans聚类算法
[m,n]=size(data);
cluster=data(randperm(m,cluster_num),:);%从m个点中随机选择cluster_num个点作为初始聚类中心点
epoch_max=1000;%最大次数
therad_lim=0.001;%中心变化阈值
epoch_num=0;
while(epoch_num<epoch_max)
epoch_num=epoch_num+1;
% distance1存储每个点到各聚类中心的欧氏距离
for i=1:cluster_num
distance=(data-repmat(cluster(i,:),m,1)).^2;
distance1(:,i)=sqrt(sum(distance'));
end
[~,index_cluster]=min(distance1');%index_cluster取值范围1~cluster_num
% cluster_new存储新的聚类中心
for j=1:cluster_num
cluster_new(j,:)=mean(data(find(index_cluster==j),:));
end
%如果新的聚类中心和上一轮的聚类中心距离和大于therad_lim,更新聚类中心,否则算法结束
if (sqrt(sum((cluster_new-cluster).^2))>therad_lim)
cluster=cluster_new;
else
break;
end
end
end(3) 对分类结果和最终的聚类中心进行可视化展示
%% 画出聚类效果
figure(2)
% subplot(2,1,1)
a=unique(index_cluster); %找出分类出的个数
c=cell(1,length(a));
for i=1:length(a)
   c(1,i)={find(index_cluster==a(i))};
end
for j=1:cluster_num
    data_get=data(c{1,j},:);
    scatter(data_get(:,1),data_get(:,2),100,'filled','markerfacealpha',.6,'markeredgealpha',.9);
    hold on
end
%绘制聚类中心
plot(cluster(:,1),cluster(:,2),'ks','linewidth',2);
hold on
sc_t=mean(silhouette(data,index_cluster'));
title_str=['原理推导k均值聚类','  聚类数为:',num2str(cluster_num),'  sc轮廓系数:',num2str(sc_t)];
title(title_str)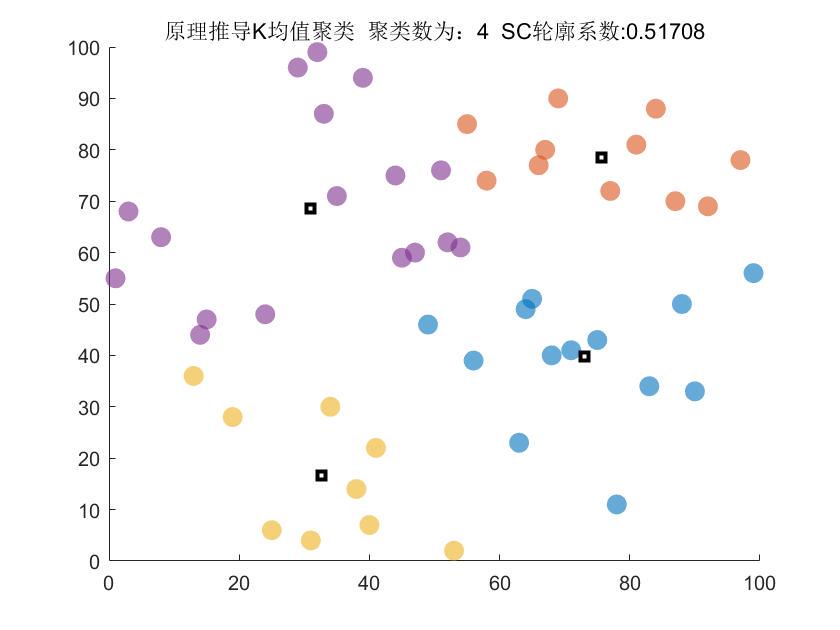
3.完整实现代码
clc;clear;close all;
data(:,1)=[90,35,52,83,64,24,49,92,99,45,19,38,1,71,56,97,63,...
    32,3,34,33,55,75,84,53,15,88,66,41,51,39,78,67,65,25,40,77,...
    13,69,29,14,54,87,47,44,58,8,68,81,31];
data(:,2)=[33,71,62,34,49,48,46,69,56,59,28,14,55,41,39,...
    78,23,99,68,30,87,85,43,88,2,47,50,77,22,76,94,11,80,...
    51,6,7,72,36,90,96,44,61,70,60,75,74,63,40,81,4];
figure(1)
scatter(data(:,1),data(:,2),'linewidth',2)
title("原始数据散点图")
cluster_num=4;
[index_cluster,cluster] = kmeans_func(data,cluster_num);
%% 画出聚类效果
figure(2)
% subplot(2,1,1)
a=unique(index_cluster); %找出分类出的个数
c=cell(1,length(a));
for i=1:length(a)
   c(1,i)={find(index_cluster==a(i))};
end
for j=1:cluster_num
    data_get=data(c{1,j},:);
    scatter(data_get(:,1),data_get(:,2),100,'filled','markerfacealpha',.6,'markeredgealpha',.9);
    hold on
end
%绘制聚类中心
plot(cluster(:,1),cluster(:,2),'ks','linewidth',2);
hold on
sc_t=mean(silhouette(data,index_cluster'));
title_str=['原理推导k均值聚类','  聚类数为:',num2str(cluster_num),'  sc轮廓系数:',num2str(sc_t)];
title(title_str)
4. 总结
以上就是matlab实现kmeans聚类算法的全部代码,可在上述代码的基础上进行数据集替换,应用于其它场景。如果有不懂的小伙伴儿,欢迎评论留言或者私信,代码订制也可私信博主。


发表评论