目录
=
■nmon简介
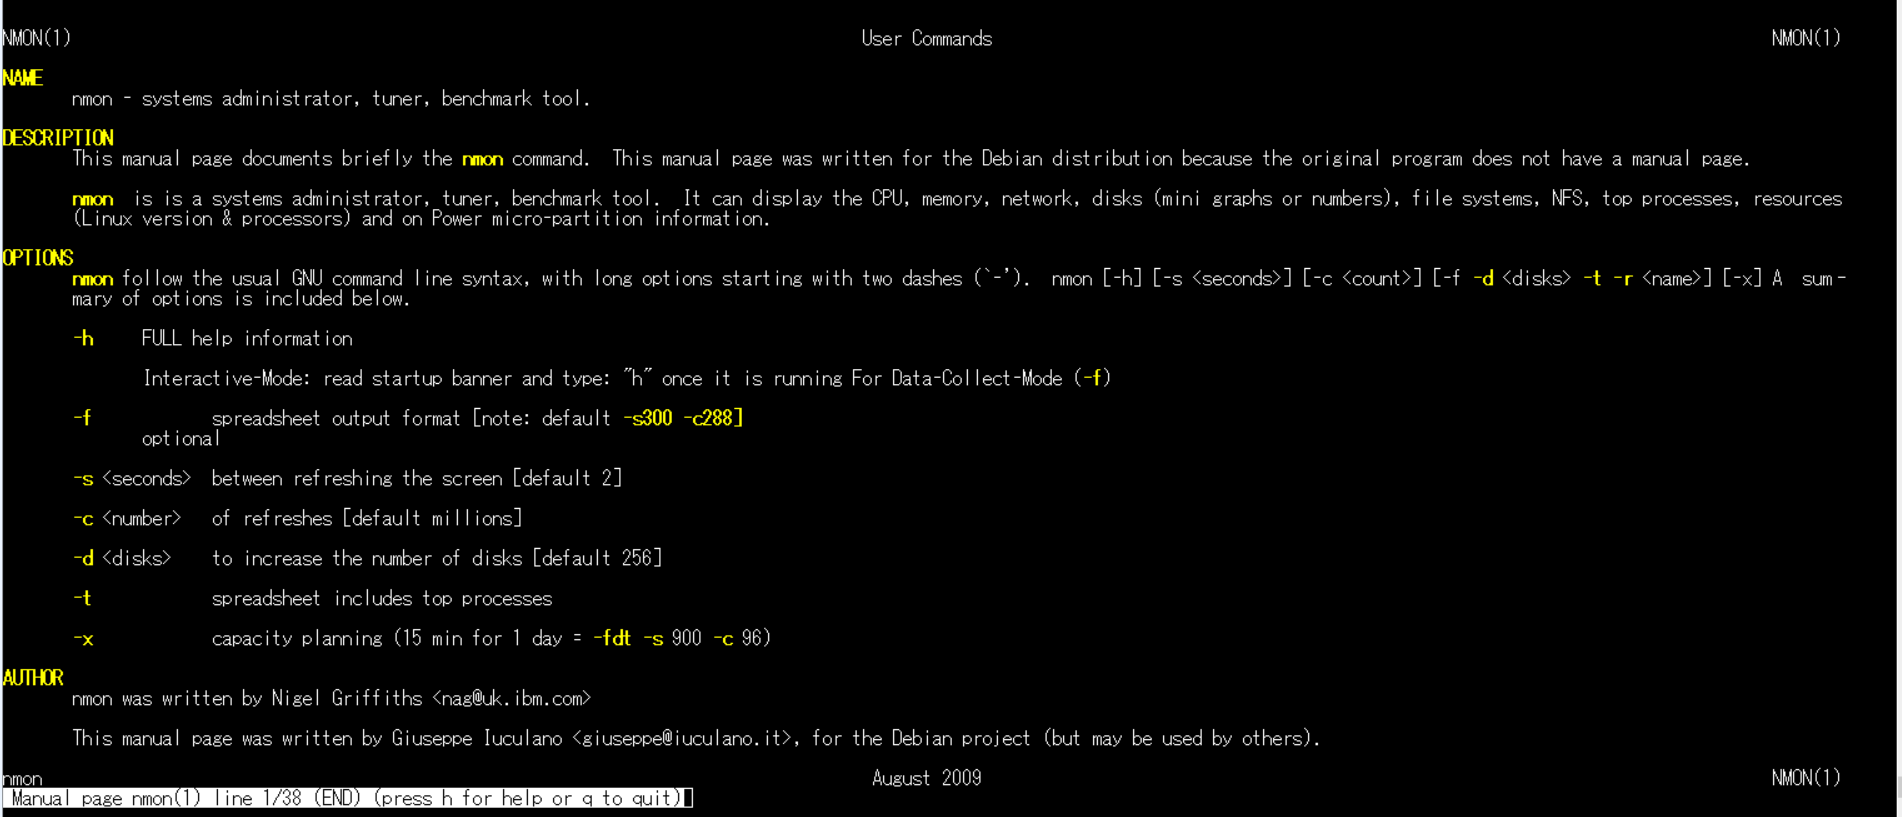
1.安装
apt-get install nmon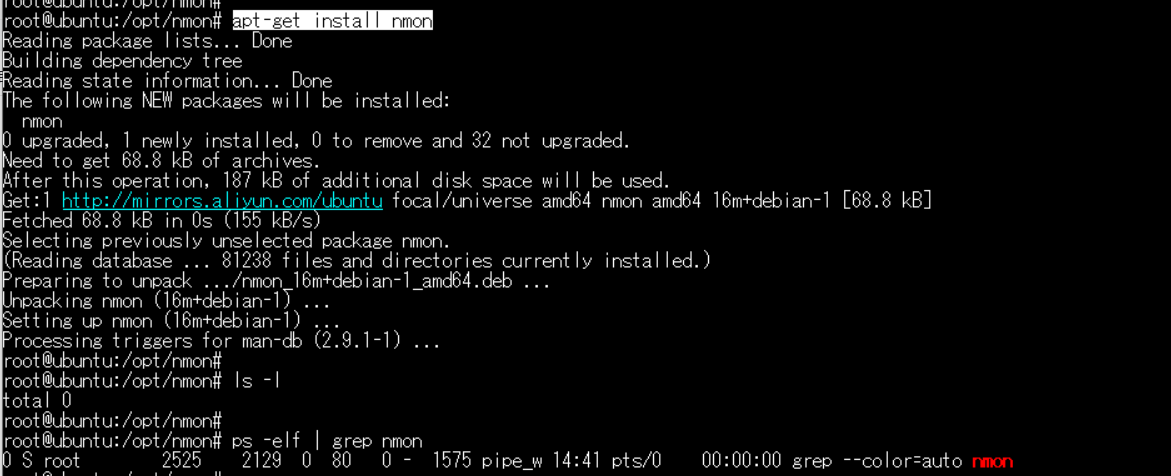
===
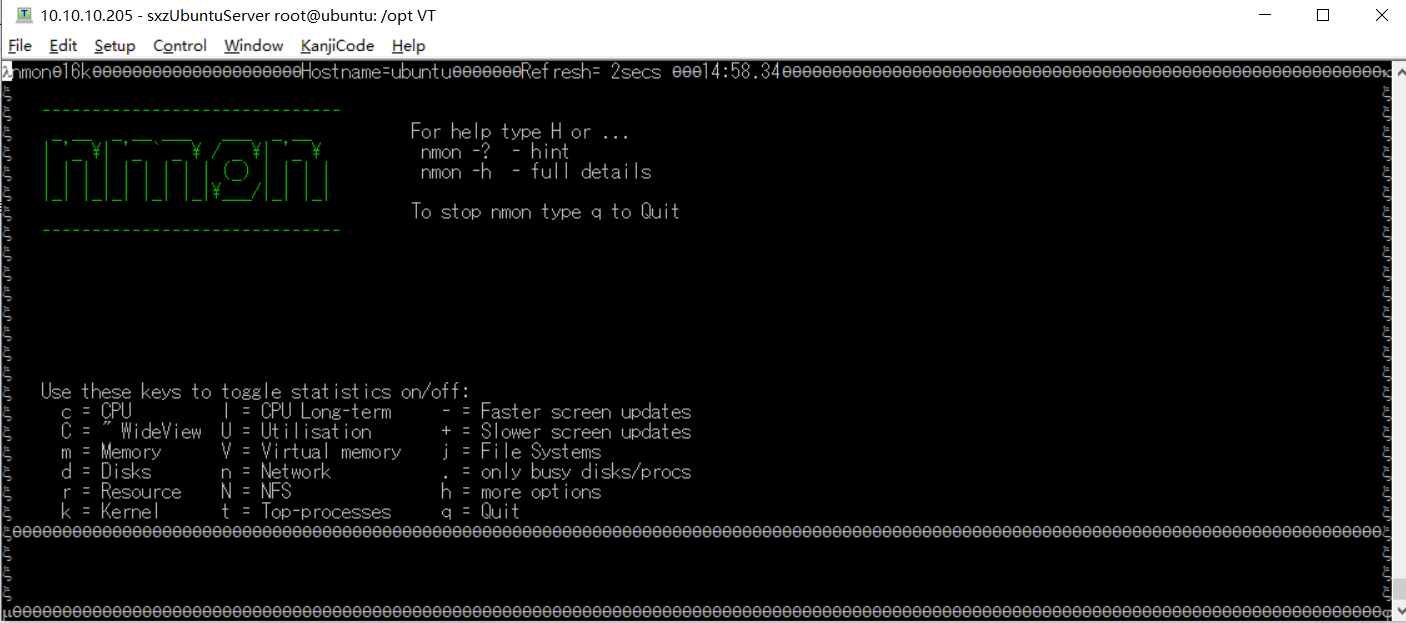
2.使用简介
输入nmon进入下面的界面
===
x   use these keys to toggle statistics on/off:                                                                                           x
x     c = cpu         l = cpu long-term     - = faster screen updates                                                                     x
x     c = " wideview  u = utilisation       + = slower screen updates                                                                     x
x     m = memory      v = virtual memory    j = file systems                                                                              x
x     d = disks       n = network           . = only busy disks/procs                                                                     x
x     r = resource    n = nfs               h = more options                                                                              x
x     k = kernel      t = top-processes     q = quit
===
3.使用(具体使用的例子【cpu】【内存】)
xx
在上面的交互式窗口中,可以使用nmon 快捷键来显示不同的系统资源统计数据:
| 命令 | 备注 |
|---|---|
| q | 停止并退出 nmon |
| h | 查看帮助 |
| c | 查看 cpu 统计数据 |
| m | 查看内存统计数据 |
| d | 查看硬盘统计数据 |
| k | 查看内核统计数据 |
| n | 查看网络统计数据 |
| n | 查看 nfs 统计数据 |
| j | 查看文件系统统计数据 |
| t | 查看高耗进程 |
| v | 查看虚拟内存统计数据 |
| v | 详细模式 |
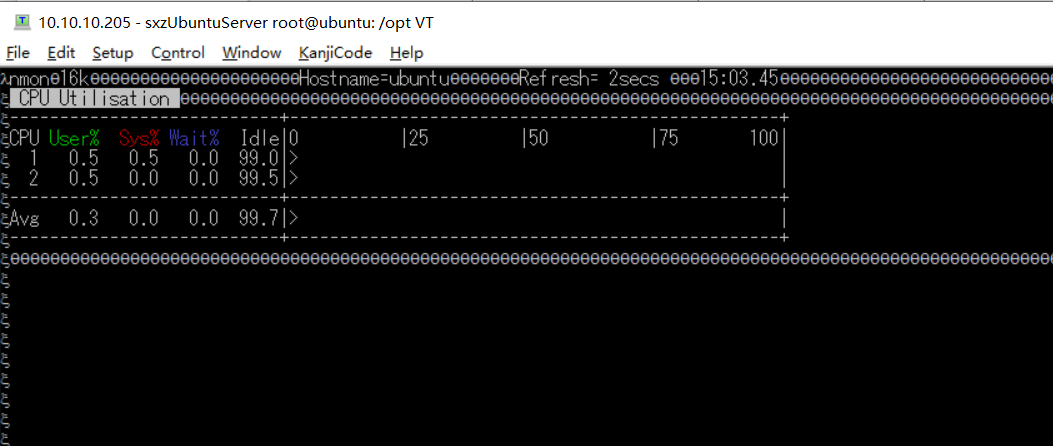
比如输入【c】查看cpu
==按下【q】退出
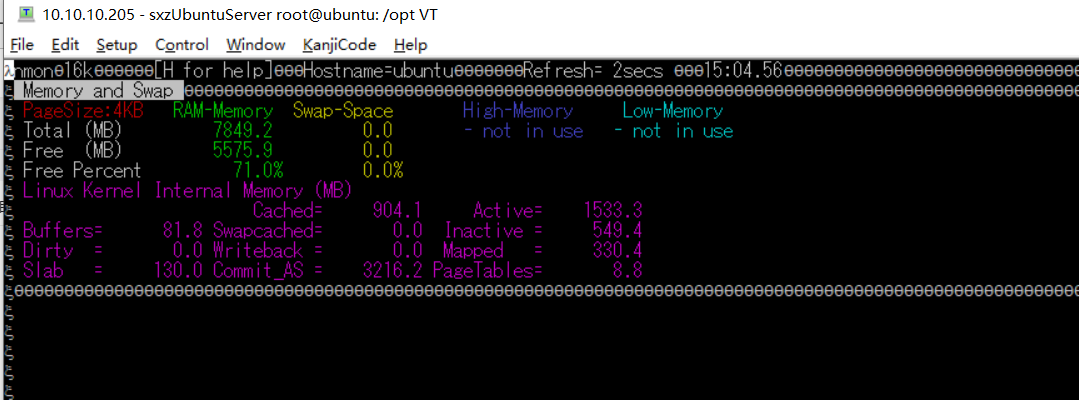
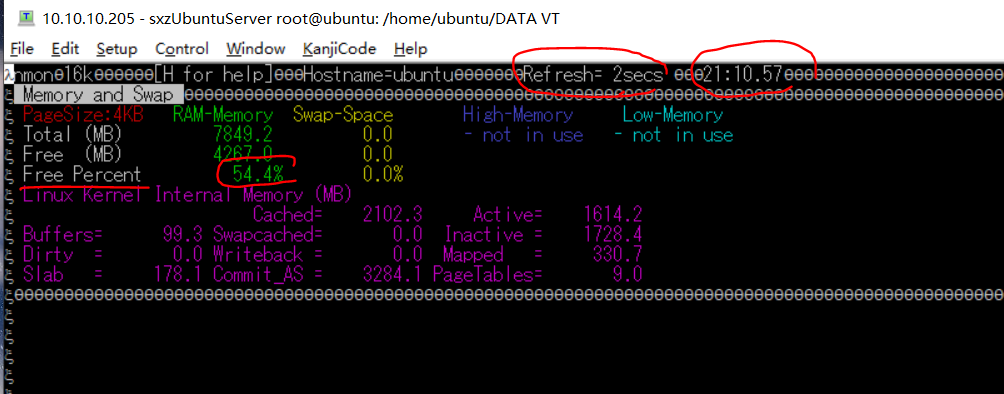
比如输入【m】查看内存 (这个时候,docker中,wordpress容器没有启动,所以空闲是 71%)
ーーー界面中,显示刷新频率,还有当前时间。
===
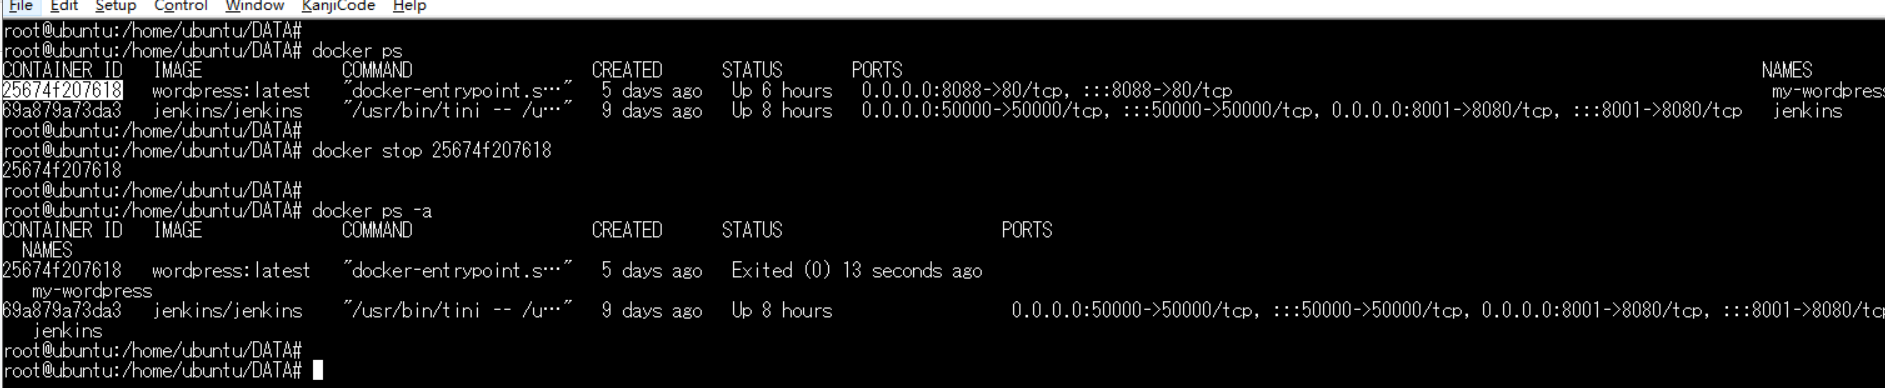
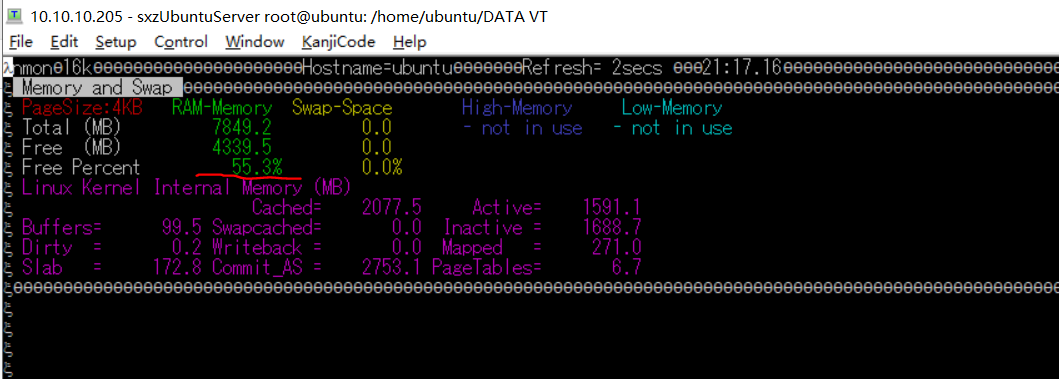
===停止之后(空闲内存54.4⇒55.3%)
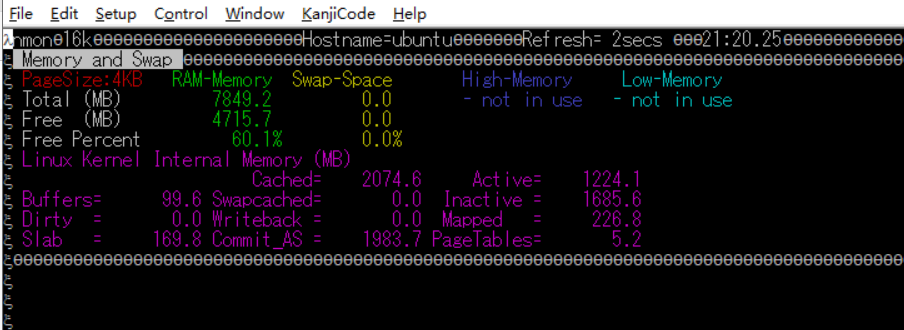
---再次关闭 jenkins的docker容器(空闲内存55.3⇒60.1%)
==按下【q】退出
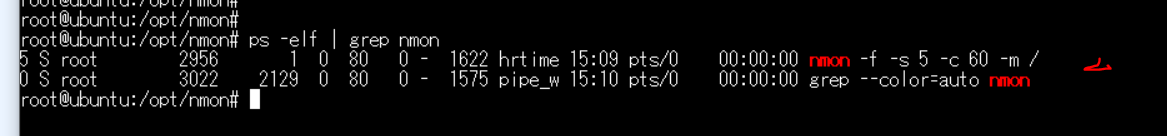
4.采集数据
如每隔5秒采集一次,一共采集60次,就是5分钟的数据:
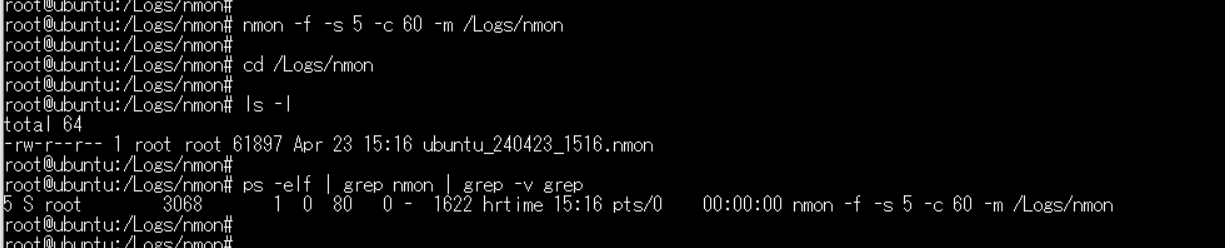
nmon -f -s 5 -c 60 -m /xx
==文件生成到了根目录下面
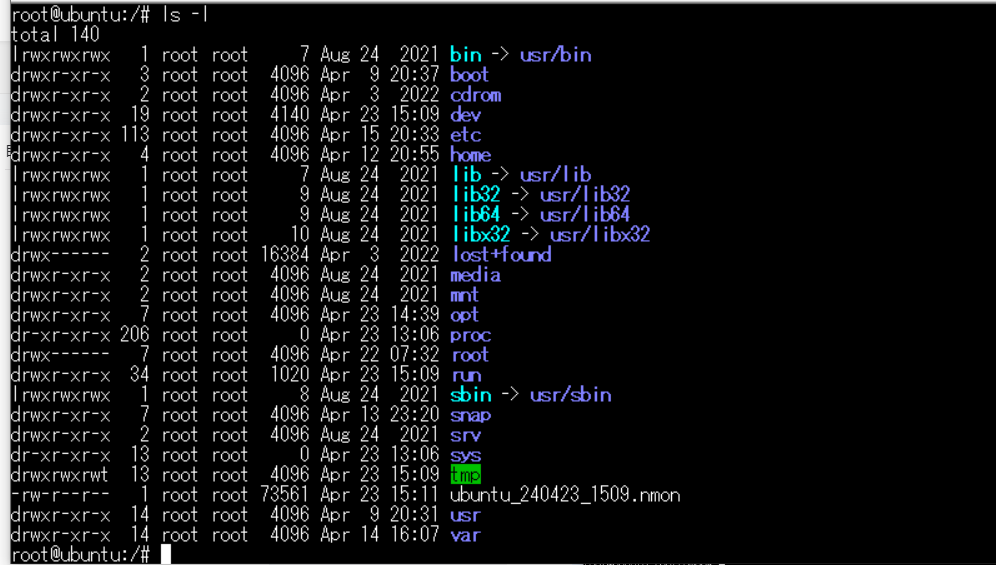
==指定log路径
nmon -f -s 5 -c 60 -m /logs/nmon===
ーーー
===
5.查看log(根据结果,生成报表)
linux系统性能相关知识学习_linux top humen-csdn博客
xxx
下载分析工具
nmon_analyser: a free tool for producing aix performance reports - ibm developer
==
6.分析结果
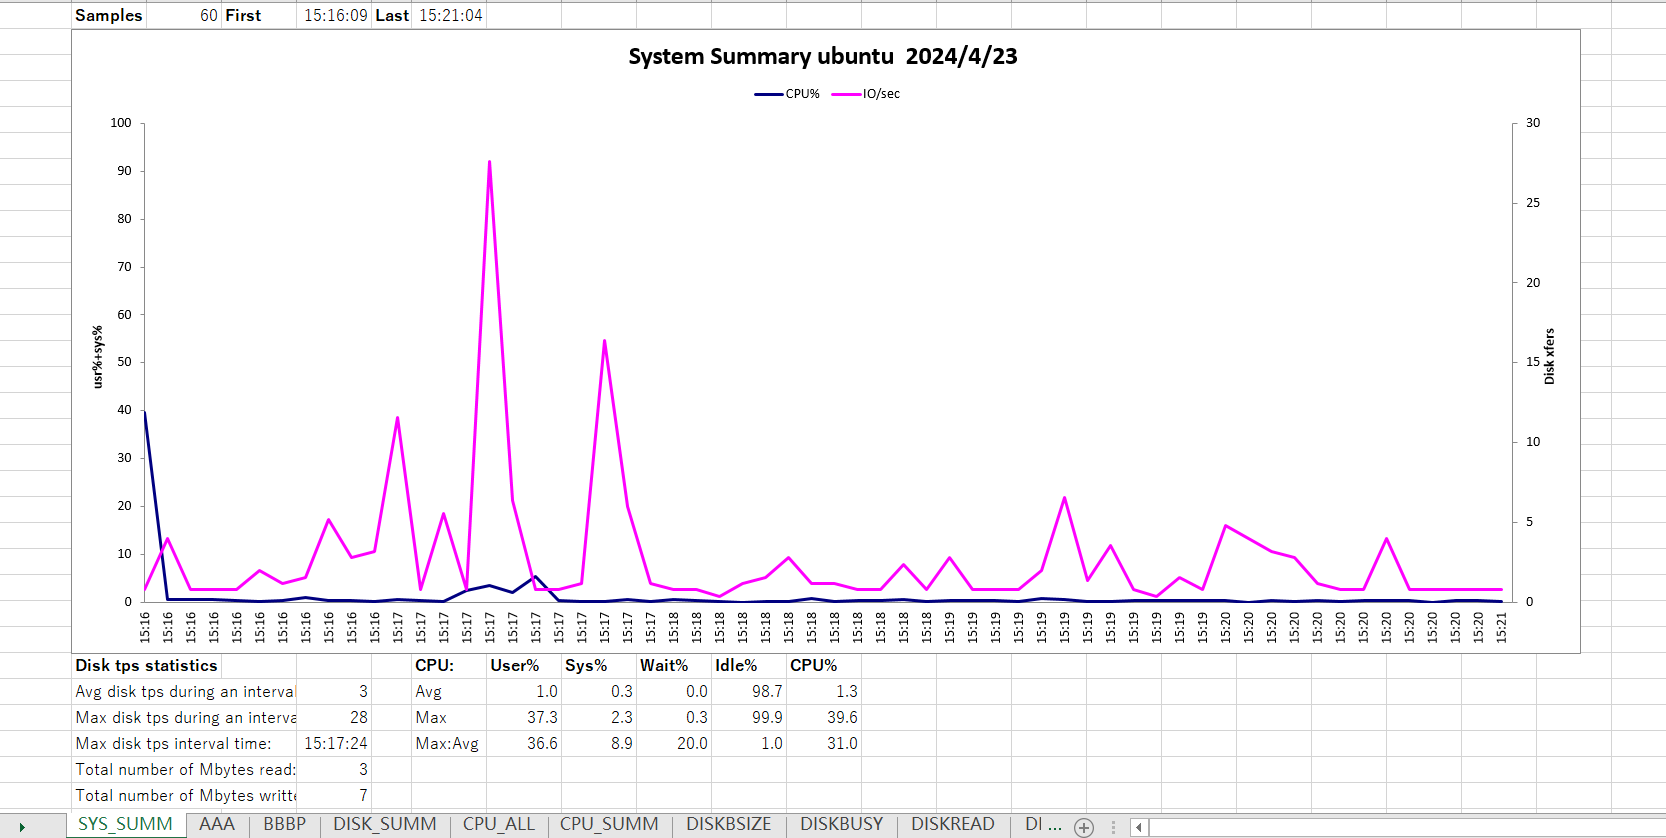
1.sys_summ
2.aaa
3.bbbp
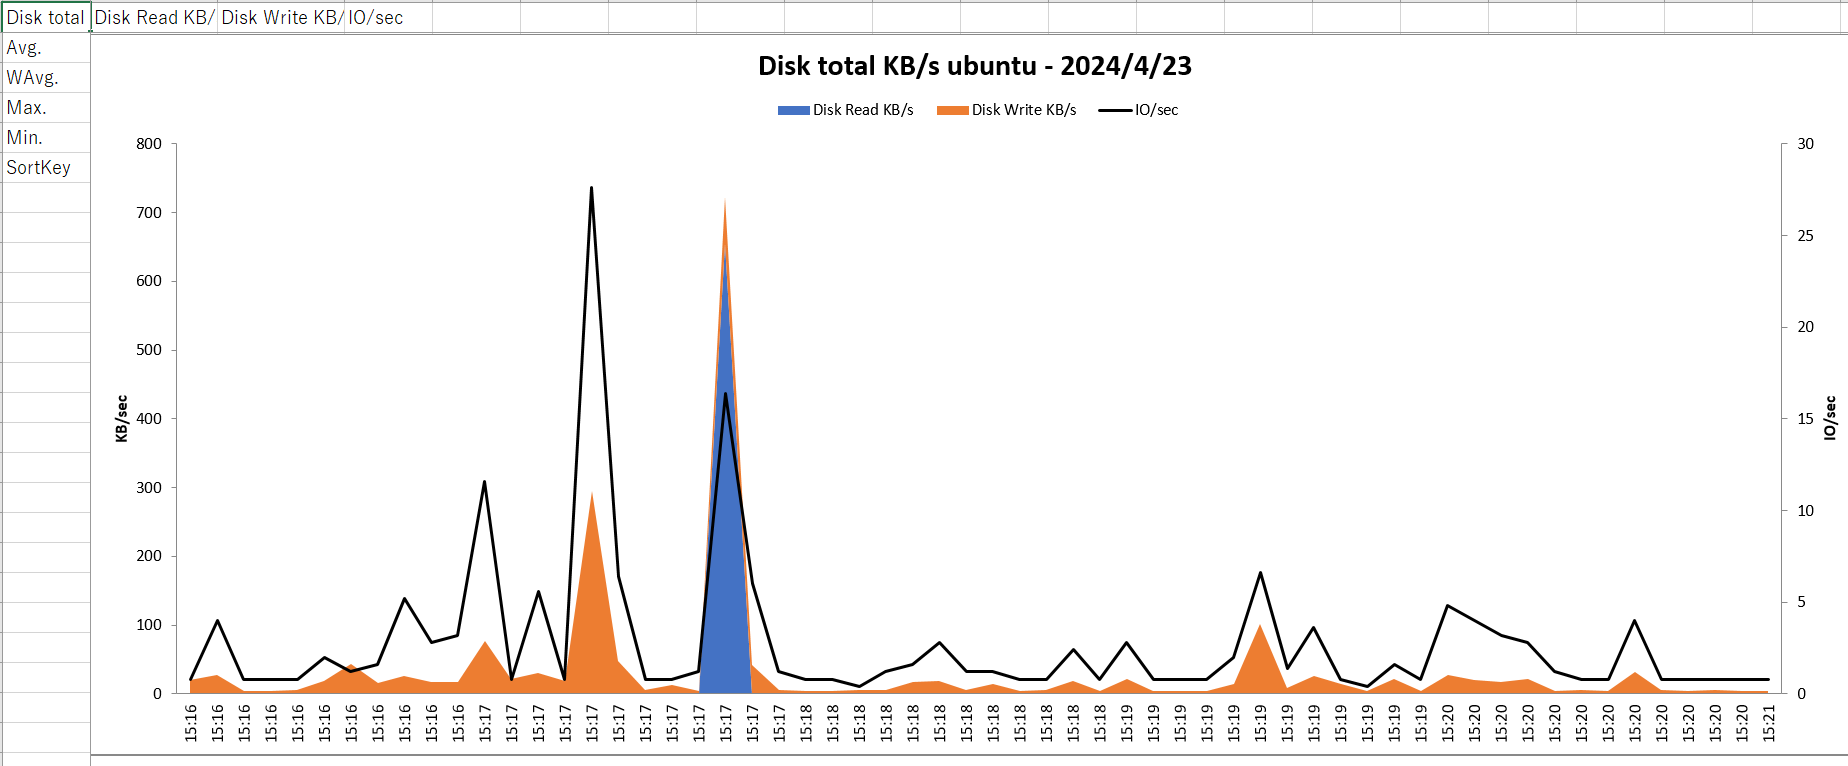
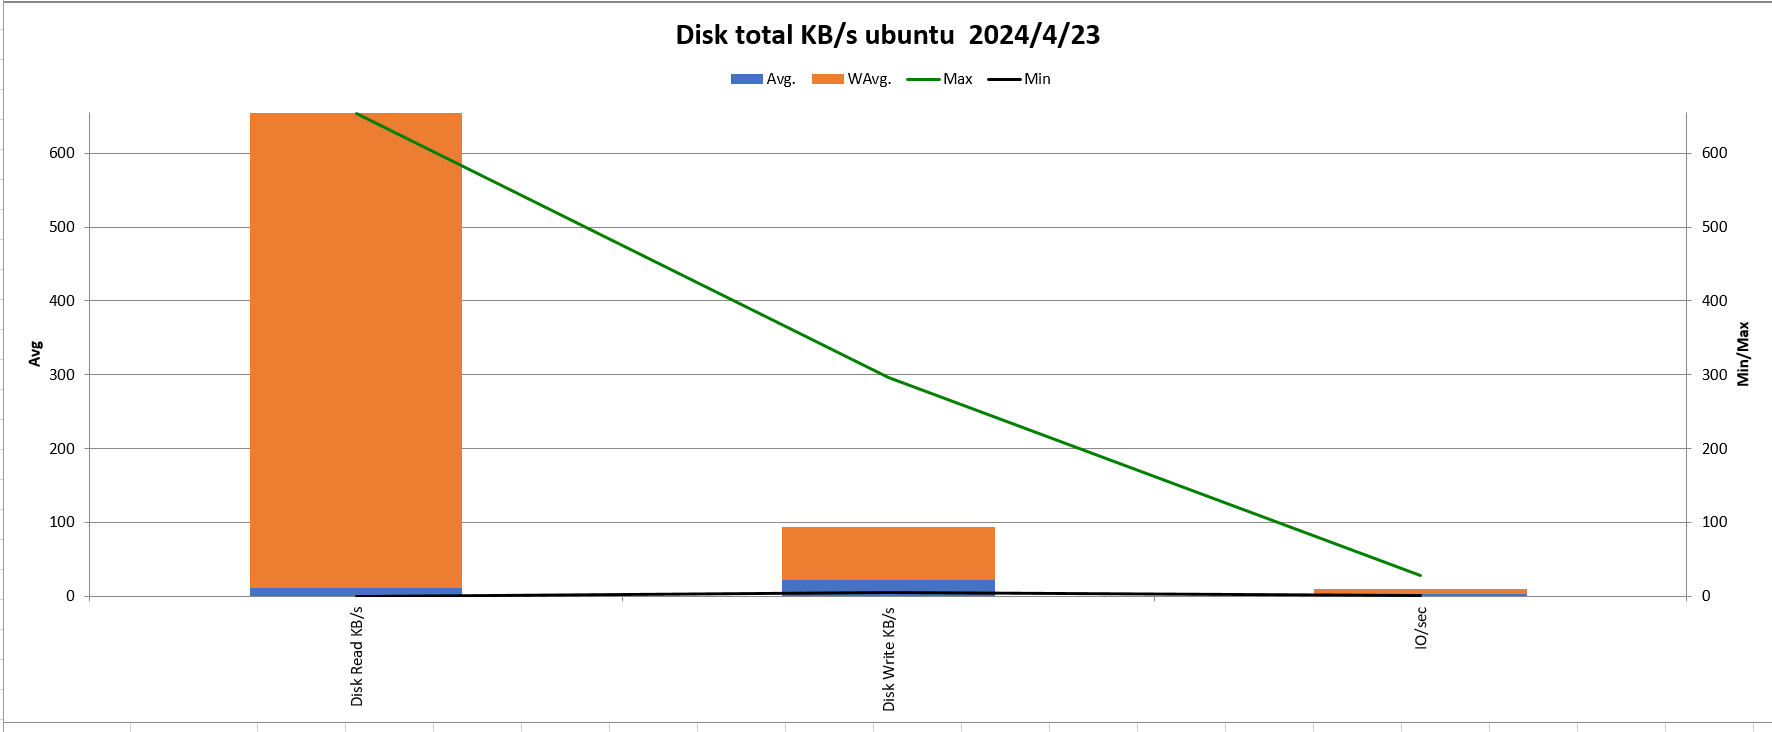
4.disk_summ
---
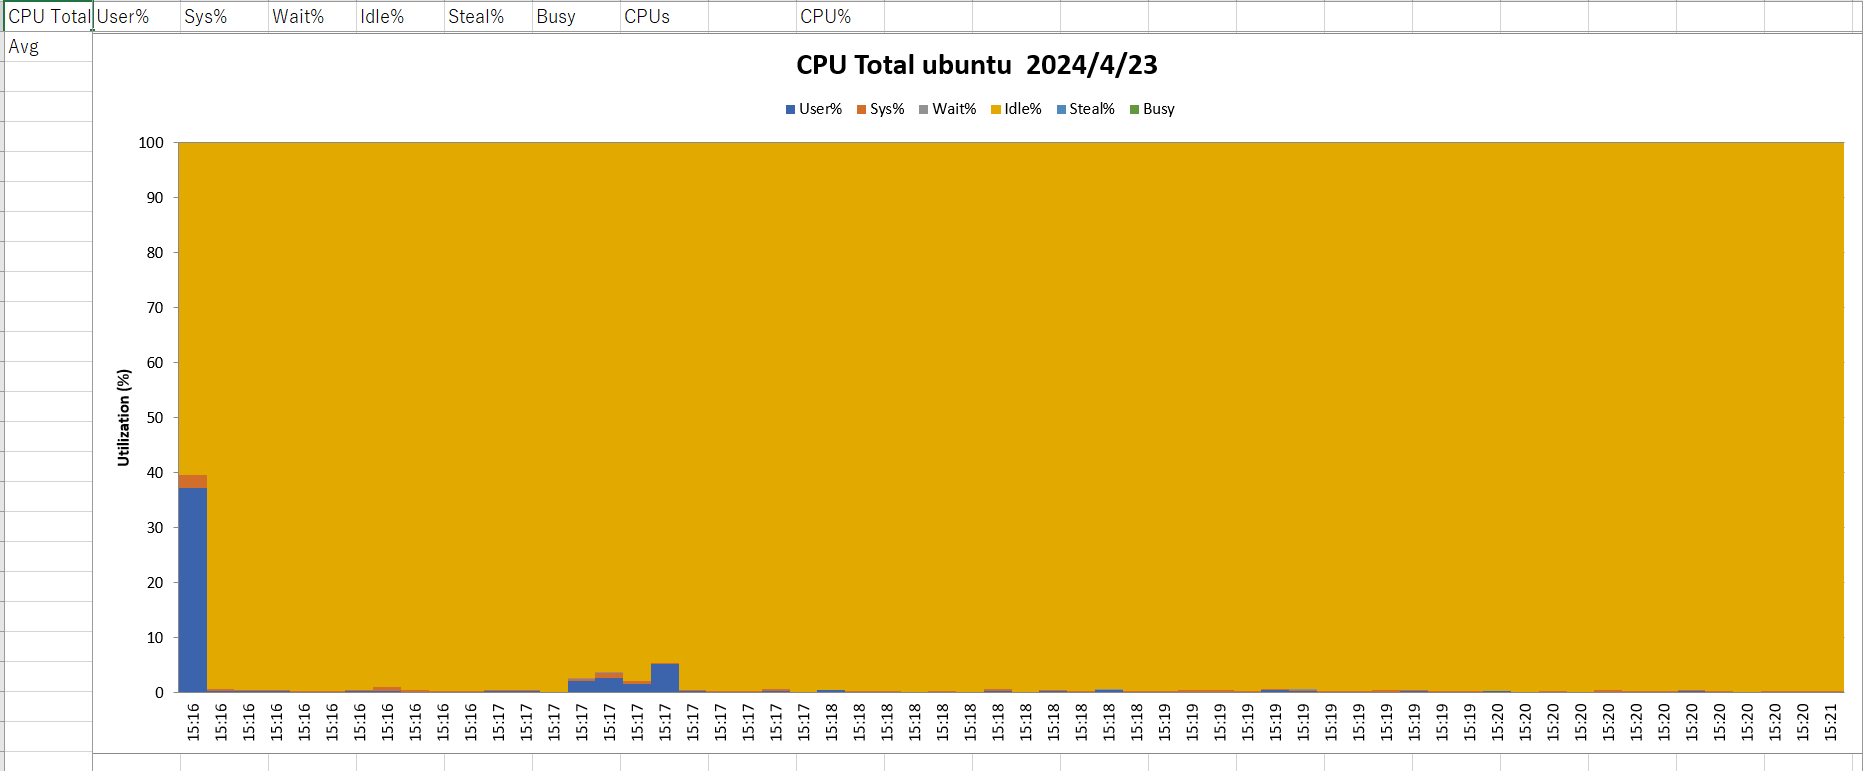
5.cpu_all
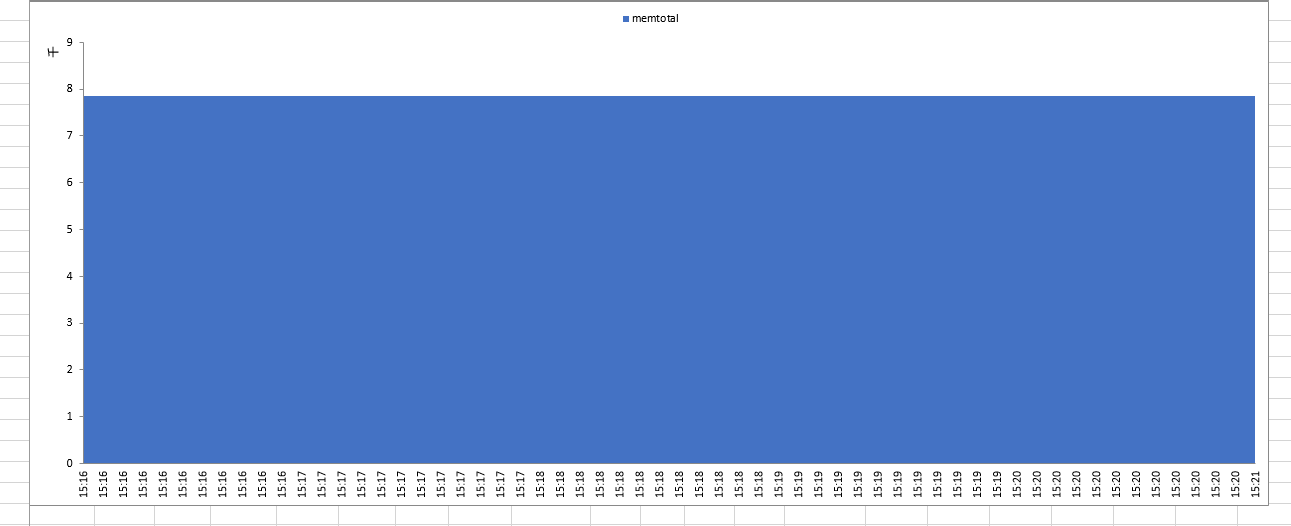
6.mem (空闲内存5.5g左右)

--(-总内存,接近8g左右)
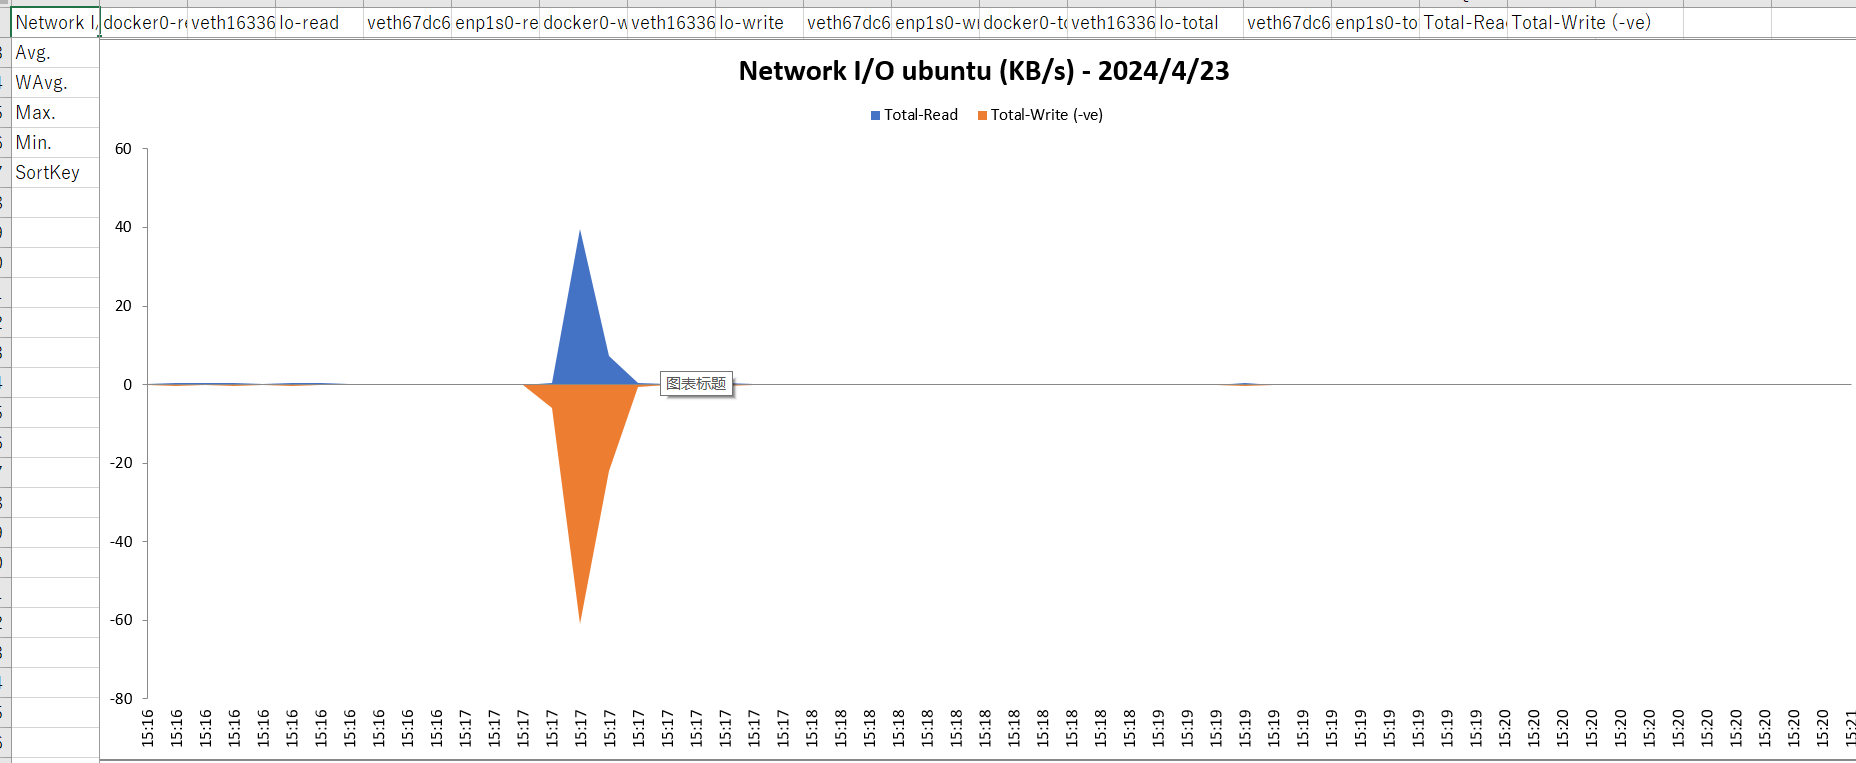
7.net
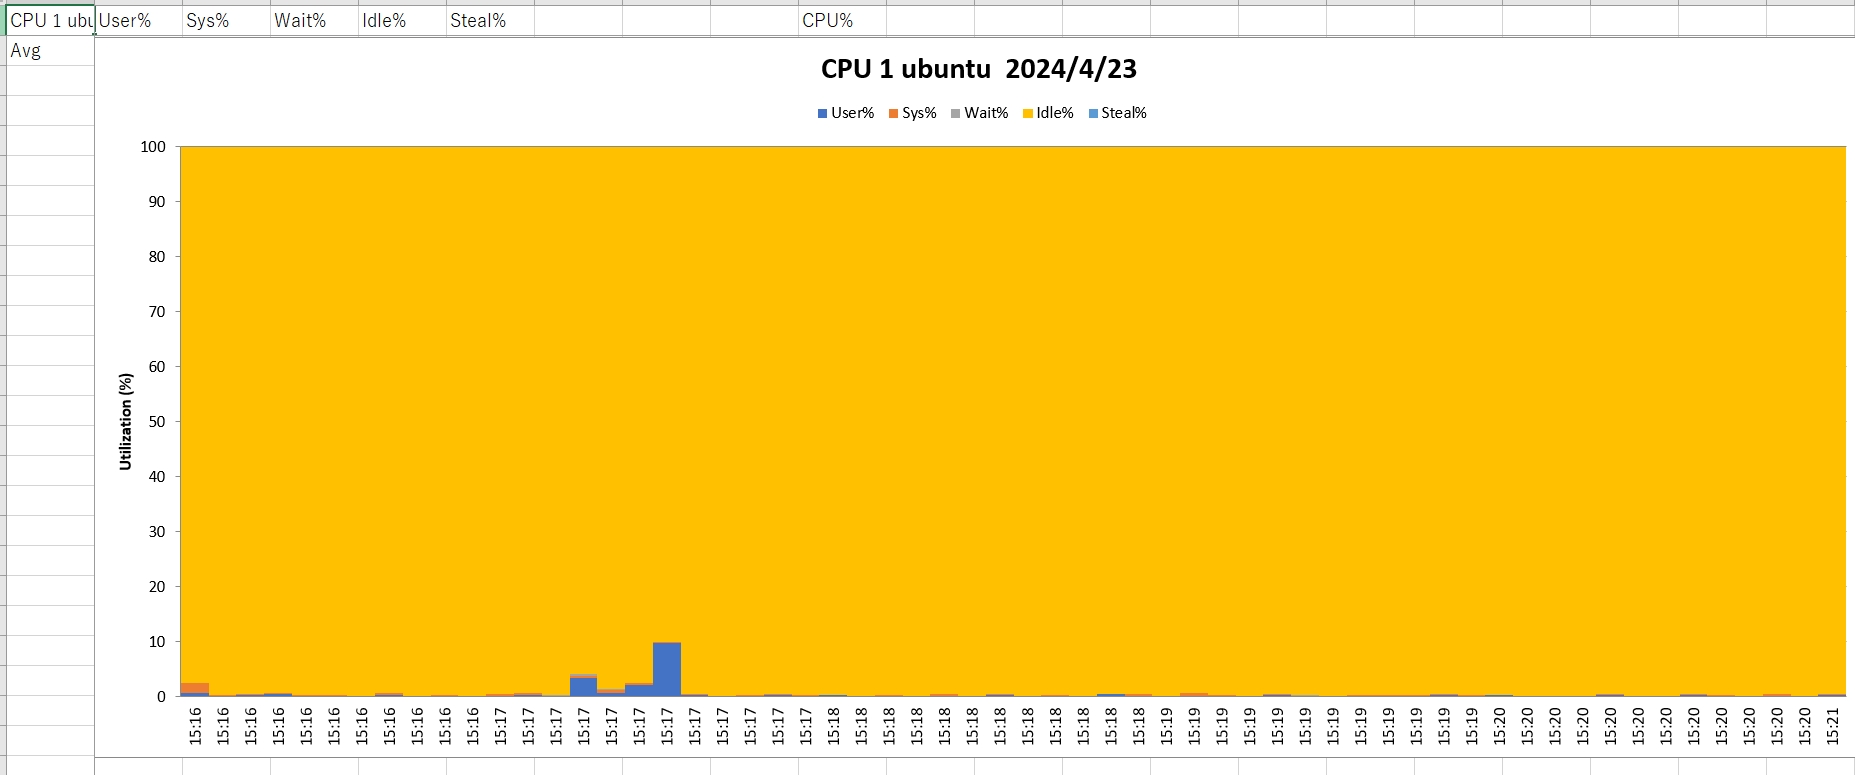
8.cpu1 (是双核cpu)
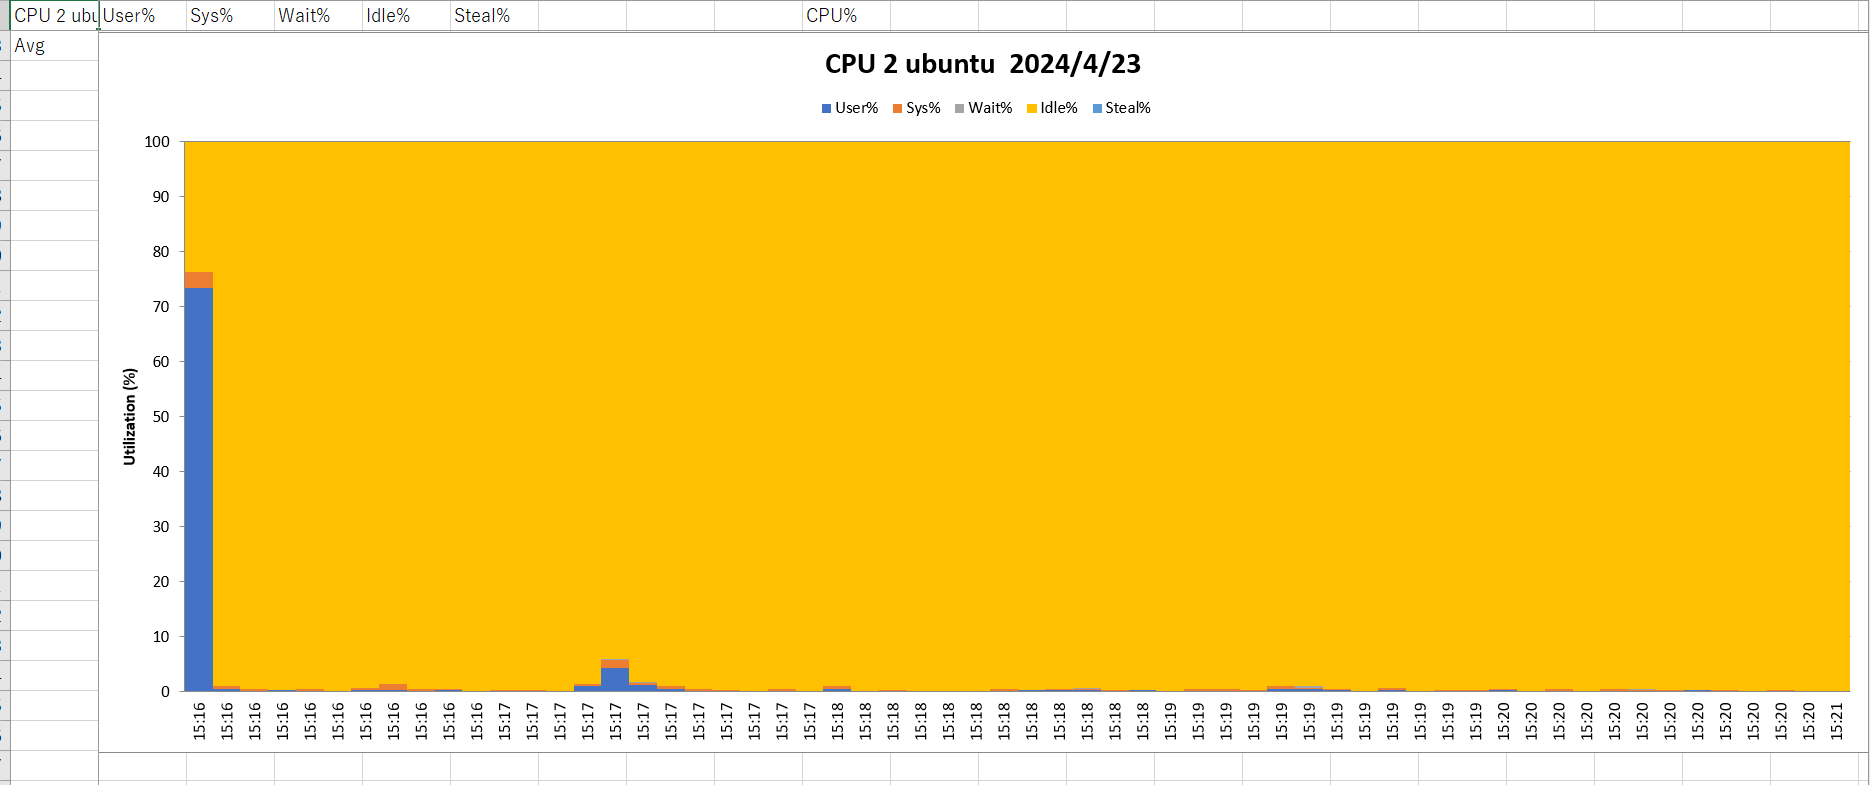
9.cpu2 (是双核cpu)
==
7.设定任务计划(cron),每日执行
linux中的cron ,任务计划_linux查看corn-csdn博客
===


发表评论