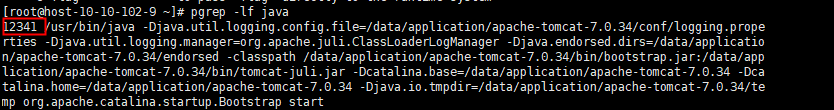
1.查看当前java进程的pid
pgrep -lf java
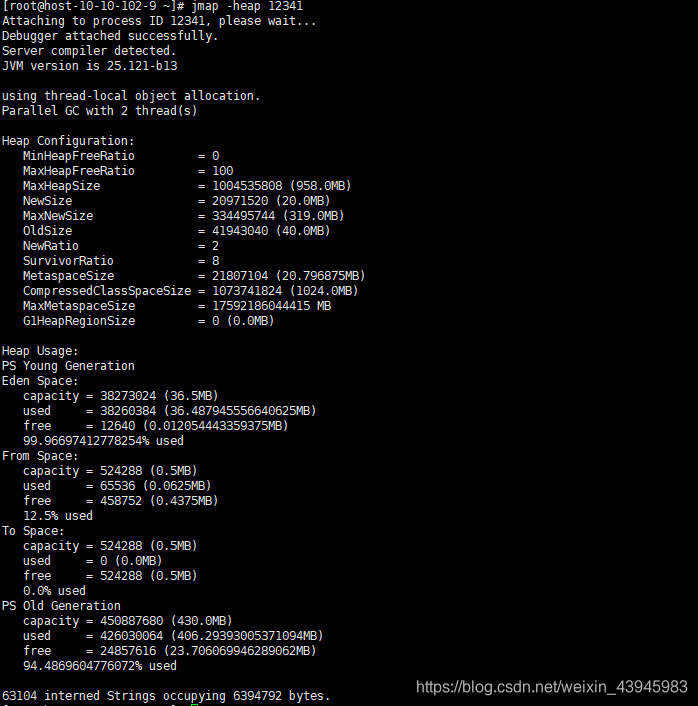
2.查看java堆的详细信息
jmap -heap pid
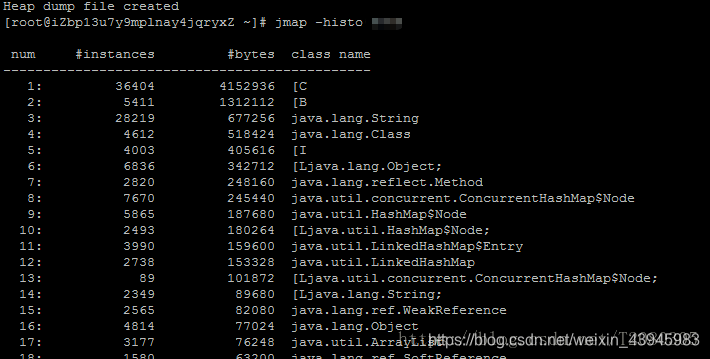
3.查看java堆中对象的相关信息
包含数量以及占用的空间大小
jmap -histo pid
4.查看监控 heap size 和 jvm垃圾回收情况
尤其是gc情况的监控,如果老年代发生full gc
那么很可能会导致内存泄漏的可能性
jstat -gcutil pid

属性参照:
- s0: survivor 0区的空间使用率 survivor space 0 utilization as a percentage of the space's current capacity.
- s1: survivor 1区的空间使用率 survivor space 1 utilization as a percentage of the space's current capacity.
- e: eden区的空间使用率 eden space utilization as a percentage of the space's current capacity.
- o: 老年代的空间使用率 old space utilization as a percentage of the space's current capacity.
- m: 元数据的空间使用率 metaspace utilization as a percentage of the space's current capacity.
- ccs: 类指针压缩空间使用率 compressed class space utilization as a percentage.
- ygc: 新生代gc次数 number of young generation gc events.
- ygct: 新生代gc总时长(从应用程序启动到采样时年轻代中gc所用时间 单位:s) young generation garbage collection time.
- fgc: full gc次数 number of full gc events.
- fgct: full gc总时长(从应用程序启动到采样时old代(全gc)gc所用时间 单位:s) full garbage collection time.
- gct: 总共的gc时长 (从应用程序启动到采样时gc用的总时间 单位:s)total garbage collection time.
注:
- full gc很具有代表性
- full gc次数 和时间 指标很能显示系统性能问题
- 这两个指标很大,很大程度上说明了程序中有问题,垃圾一直回收不掉
总结
以上为个人经验,希望能给大家一个参考,也希望大家多多支持代码网。


发表评论