在绘制图表时,我们有时需要实现一些交互式操作,例如图表缩放、显示鼠标光标处的数据,坐标、选择曲线上的数据点、显示或隐藏序列等。
具体功能
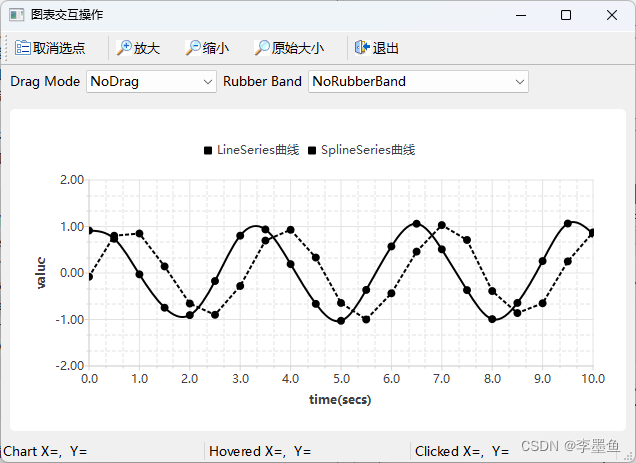
- 图表中包含一个 qlineseries 序列和一个qsplineseries 序列,且显示了数据点。
- 在图表上拖动鼠标时可以放大图表,或拖动曲线移动。使用鼠标滚轮可以放大或缩小图表。
- 鼠标光标在图表上移动时,会在状态栏上实时显示鼠标光标处的数据坐标。
- 鼠标光标移动到一个序列上时,序列颜色会变为红色,并显示曲线上的坐标;鼠标光标移出序列,时序列颜色恢复为黑色。
- 点击序列上的数据点,数据点的选中状态就会改变。选中的数据点会用专门的颜色显示,并且数据点标记要大于正常数据点的标记,如图 12-9 中所示的几个大一些的数据点。
- 图例具有类似于复选框的功能,点击图例某一项就可以显示或隐藏对应的序列。
图表交互操作概述
qchart类的功能函数
qchart 的上层父类是 qgraphicsitem,其功能类似于图形/视图架构中的图形项的功能。qchart有一些接口函数可实现图表的移动、缩放等操作
qpointf maptoposition(const qpointf &value, qabstractseries *series = nullptr)
qpointf maptovalue(const qpointf &position, qabstractseries *series = nullptr)
void zoom(qreal factor) //缩放图表,factor 值大于 1 表示放大,factor 值为 0~1 表示缩小
void zoomin() //放大 2 倍
void zoomin(const qrectf &rect) //放大到最大,使得 rect 表示的矩形范围依然能被显示
void zoomout() //缩小到原来的一半
void zoomreset() //恢复原始大小
void scroll(qreal dx, qreal dy) //移动图表的可视区域,参数单位是像素
qchartview的自动放大功能
qchartview 有一个函数 setrubberband()可以设置在视图上用鼠标框选时的放大模式:
void qchartview::setrubberband(const qchartview::rubberbands &rubberband)
枚举类型 qchartview::rubberband 有以下几种枚举值。
• qchartview::norubberband:无任何动作,不自动放大。
• qchartview::verticalrubberband:拖动鼠标时,自动绘制一个矩形框,宽度等于整个图的宽度,高度等于鼠标拖动的范围的高度。释放鼠标后,放大显示此矩形框内的内容。
• qchartview::horizontalrubberband:拖动鼠标时,自动绘制一个矩形框,高度等于整个图的高度,宽度等于鼠标拖动的范围的宽度。释放鼠标后,放大显示此矩形框内的内容。
• qchartview::rectanglerubberband:拖动鼠标时,自动绘制一个矩形框,宽度和高度分别等于鼠标拖动的范围的宽度和高度。释放鼠标后,显示效果与 verticalrubberband 模式的基本相同,只是垂直方向放大,没有放大显示框选的矩形框的内容。这应该是 qt 6.2 的一个 bug。
• qchartview::clickthroughrubberband:这是一个额外的选项,需要与其他选项进行或运算,再作为函数 setrubberband()的参数。使用这个选项后,鼠标的 clicked()信号才会被传递给图表中的序列对象,否则,在自动框选放大模式下,序列接收不到 clicked()信号。
在 qchartview 的父类 qgraphicsview 中有一个函数 setdragmode(),用于设置鼠标拖动模式,
它的函数原型定义如下:
void qgraphicsview::setdragmode(qgraphicsview::dragmode mode)
参数 mode 是枚举类型 qgraphicsview::dragmode,其各种枚举值的作用如下。
• qgraphicsview::nodrag:无动作。
• qgraphicsview::scrollhanddrag:鼠标光标变成手形,拖动鼠标时会拖动图中的曲线。
• qgraphicsview::rubberbanddrag:鼠标光标变成十字形,拖动鼠标时会自动绘制一个矩形框。
函数 setdragmode()设置的值不会影响 qchartview 的自动放大功能,即不管 setdragmode()设置的是什么鼠标拖动模式,只要函数 setrubberband()设置的是某种自动放大模式,在拖动鼠标时图表就会放大
qxyseries类的信号
qlineseries 的父类 qxyseries 中定义了很多信号,其中对于交互式操作比较有用
的是如下几个信号。
- void clicked(const qpointf &point) //点击了曲线
- void doubleclicked(const qpointf &point) //双击了曲线
- void hovered(const qpointf &point, bool state) //鼠标光标移入或移出了曲线
- void pressed(const qpointf &point) //鼠标光标在曲线上,按下了某个鼠标键
- void released(const qpointf &point) //鼠标光标在曲线上,释放了某个鼠标键
自定义图表视图类tchartview
tchartview的定义
需要在 qchartview 组件里对鼠标事件和按键事件进行处理,这就需要自定义一个从
qchartview 继承的类。
tchartview 类的定义如下:
class tchartview : public qchartview
{
 q_object
private:
 qpoint beginpoint; //选择矩形区域的起点
 qpoint endpoint; //选择矩形区域的终点
 bool m_customzoom= false; //是否使用自定义矩形放大模式
protected:
 void mousepressevent(qmouseevent *event); //鼠标左键被按下
 void mousereleaseevent(qmouseevent *event); //鼠标左键被释放
 void mousemoveevent(qmouseevent *event); //鼠标移动
 void keypressevent(qkeyevent *event); //按键事件
 void wheelevent(qwheelevent *event); //鼠标滚轮事件,缩放
public:
 tchartview(qwidget *parent = nullptr);
 ~tchartview();
 void setcustomzoomrect(bool custom); //设置是否使用自定义矩形放大模式
signals:
 void mousemovepoint(qpoint point); //鼠标移动信号
};
下面是 tchartview 类构造函数和公有函数 setcustomzoomrect()的代码:
tchartview::tchartview(qwidget *parent):qchartview(parent)
{
     this->setmousetracking(true); //必须设置为 true,这样才会实时产生 	mousemoveevent 事件
     this->setdragmode(qgraphicsview::nodrag); //设置拖动模式
     this->setrubberband(qchartview::norubberband); //设置自动放大模式
}

void tchartview::setcustomzoomrect(bool custom)
{
 	m_customzoom= custom;
}
对鼠标框选的处理
拖动鼠标框选范围时,会触发 mousepressevent()和 mousereleaseevent()事件处理函数,这两个函数的代码如下:
void tchartview::mousepressevent(qmouseevent *event)
{//鼠标左键被按下,记录 beginpoint
     if (event->button() == qt::leftbutton)
     beginpoint= event->pos();
     qchartview::mousepressevent(event); //父类继续处理事件,必须如此调用
}
void tchartview::mousereleaseevent(qmouseevent *event)
{
     if (event->button() == qt::leftbutton)
     {
         endpoint= event->pos();
         if ((this->dragmode() == qgraphicsview::scrollhanddrag)
         &&(this->rubberband() == qchartview::norubberband)) //移动
             chart()->scroll(beginpoint.x()-endpoint.x(), endpoint.y() - beginpoint.y());
         else if (m_customzoom && this->dragmode() == qgraphicsview::rubberbanddrag)
         {//放大
             qrectf rectf;
             rectf.settopleft(beginpoint);
             rectf.setbottomright(endpoint);
             this->chart()->zoomin(rectf); //按矩形区域放大
         }
     }
     qchartview::mousereleaseevent(event); //父类继续处理事件,必须如此调用
}
其他事件的处理
void tchartview::mousemoveevent(qmouseevent *event)
{//鼠标移动事件
     qpoint point= event->pos();
     emit mousemovepoint(point); //发射信号
     qchartview::mousemoveevent(event); //父类继续处理事件
}
void tchartview::keypressevent(qkeyevent *event)
{//按键控制
 switch (event->key())
 {
 case qt::key_left:
 	chart()->scroll(10, 0); break;
 case qt::key_right:
 	chart()->scroll(-10, 0); break;
 case qt::key_up:
 	chart()->scroll(0, -10); break;
 case qt::key_down:
 	chart()->scroll(0, 10); break;
 case qt::key_pageup:
 	chart()->scroll(0, -50); break;
 case qt::key_pagedown:
 	chart()->scroll(0, 50); break;
 case qt::key_escape:
 	chart()->zoomreset(); break;
 default:
 	qgraphicsview::keypressevent(event);
 }
}
void tchartview::wheelevent(qwheelevent *event)
{//鼠标滚轮事件处理,缩放
     qpoint numdegrees = event->angledelta()/8;
     if (!numdegrees.isnull())
     {
         qpoint numsteps = numdegrees/15; //步数
         int stepy=numsteps.y(); //垂直方向上滚轮的滚动步数
         if (stepy >0) //大于 0,前向滚动,放大
         	chart()->zoom(1.1*stepy);
         else
         	chart()->zoom(-0.9*stepy);
     }
     event->accept();
}
主窗口设计和初始化
采用可视化方法设计主窗口界面,在工作区放置一个 qgraphicsview 组件,然后将其提升为tchartview 类,将其对象名称设置为 chartview。主窗口类 mainwindow 的定义如下:
class mainwindow : public qmainwindow
{
 q_object
private:
 qchart *chart; //图表对象
 qlabel *lab_chartxy; //状态栏上的标签
 qlabel *lab_hoverxy;
 qlabel *lab_clickxy;
 void createchart(); //创建图表
 void preparedata(); //准备数据
 int getindexfromx(qxyseries *series, qreal xvalue, qreal tol=0.05);
 //返回数据点的序号
public:
 mainwindow(qwidget *parent = nullptr);
private slots:
 void do_legendmarkerclicked(); //图例被点击
 void do_mousemovepoint(qpoint point); //鼠标移动
 void do_series_clicked(const qpointf &point); //序列被点击
 void do_series_hovered(const qpointf &point, bool state); //移入或移出序列
private:
 ui::mainwindow *ui;
};
mainwindow 类中有几个自定义槽函数,用于与一些信号关联并进行处理。函数 getindexfromx()用于在一个序列中根据参数xvalue的值确定数据点的序号,在用鼠标选择数据点时会用到这个函数。
mainwindow 类的构造函数代码如下:
mainwindow::mainwindow(qwidget *parent) : qmainwindow(parent), ui(new ui::mainwindow)
{
     ui->setupui(this);
     this->setcentralwidget(ui->chartview);
     lab_chartxy = new qlabel("chart x=, y= "); //用于添加到状态栏的 qlabel 组件
     lab_chartxy->setminimumwidth(200);
     ui->statusbar->addwidget(lab_chartxy);
     lab_hoverxy = new qlabel("hovered x=, y= ");
     lab_hoverxy->setminimumwidth(200);
     ui->statusbar->addwidget(lab_hoverxy);
     lab_clickxy = new qlabel("clicked x=, y= ");
     lab_clickxy->setminimumwidth(200);
     ui->statusbar->addwidget(lab_clickxy);
     createchart(); //创建图表
     preparedata(); //生成数据
     connect(ui->chartview,signal(mousemovepoint(qpoint)),
     this, slot(do_mousemovepoint(qpoint))); //鼠标移动事件
}
构造函数里创建了图表,还将 chartview 的 mousemovepoint()信号与槽函数 do_mousemovepoint()关联。创建图表的代码如下:
void mainwindow::createchart()
{ //创建图表
 chart = new qchart();
 ui->chartview->setchart(chart);
 ui->chartview->setrenderhint(qpainter::antialiasing);
 ui->chartview->setcursor(qt::crosscursor); //设置鼠标光标为十字形
 qlineseries *series0 = new qlineseries();
 series0->setname("lineseries 曲线");
 series0->setpointsvisible(true); //显示数据点
 series0->setmarkersize(5); //数据点大小
 series0->setselectedcolor(qt::blue); //选中点的颜色
 connect(series0,&qlineseries::clicked, this, &mainwindow::do_series_clicked);
 connect(series0,&qlineseries::hovered, this, &mainwindow::do_series_hovered);
 qsplineseries *series1 = new qsplineseries();
 series1->setname("splineseries 曲线");
 series1->setpointsvisible(true);
 series1->setmarkersize(5);
 series1->setselectedcolor(qt::blue); //选中点的颜色
 connect(series1,&qsplineseries::clicked, this, &mainwindow::do_series_clicked);
 connect(series1,&qsplineseries::hovered, this, &mainwindow::do_series_hovered);
 qpen pen(qt::black);
 pen.setstyle(qt::dotline); //虚线
 pen.setwidth(2);
 series0->setpen(pen);
 pen.setstyle(qt::solidline); //实线
 series1->setpen(pen);
 chart->addseries(series0);
 chart->addseries(series1);
 qvalueaxis *axisx = new qvalueaxis;
 axisx->setrange(0, 10);
 axisx->setlabelformat("%.1f"); //标签格式
 axisx->settickcount(11); //主刻度个数
 axisx->setminortickcount(2);
 axisx->settitletext("time(secs)");
 qvalueaxis *axisy = new qvalueaxis;
 axisy->setrange(-2, 2);
 axisy->setlabelformat("%.2f"); //标签格式
 axisy->settickcount(5);
 axisy->setminortickcount(2);
 axisy->settitletext("value");
 chart->addaxis(axisx,qt::alignbottom); //坐标轴添加到图表中,并指定方向
 chart->addaxis(axisy,qt::alignleft);
 series0->attachaxis(axisx); //序列 series0 附加坐标轴
 series0->attachaxis(axisy);
 series1->attachaxis(axisx); //序列 series1 附加坐标轴
 series1->attachaxis(axisy);
 foreach (qlegendmarker* marker, chart->legend()->markers())
 connect(marker, signal(clicked()), this, slot(do_legendmarkerclicked()));
}
void mainwindow::preparedata()
{//为序列生成数据
 qlineseries *series0= (qlineseries *)chart->series().at(0);
 qsplineseries *series1= (qsplineseries *)chart->series().at(1);
 qreal t=0, y1,y2, intv=0.5;
 int cnt= 21;
 for(int i=0; i<cnt; i++)
 {
 int rd= qrandomgenerator::global()->bounded(-5,6); //随机整数,[-5,5]
 y1= qsin(2*t)+rd/50;
 series0->append(t,y1);
 rd= qrandomgenerator::global()->bounded(-5,6); //随机整数,[-5,5]
 y2= qsin(2*t+20)+rd/50;
 series1->append(t,y2);
 t += intv;
 }
}
交互操作功能的实现
鼠标移动时显示光标处的坐标
自定义槽函数 do_mousemovepoint()与界面组件 chartview 的 mousemovepoint()信号关联,该函数代码如下:
void mainwindow::do_mousemovepoint(qpoint point)
{
 qpointf pt= chart->maptovalue(point); //变换为图表的坐标
 qstring str= qstring::asprintf("chart x=%.1f,y=%.2f",pt.x(),pt.y());
 lab_chartxy->settext(str); //状态栏上显示
}
qlegendmarker 的使用
主要是利用qlegendmarker 的点击信号关联自定义槽函数,而qlegendmarker的成员函数type可以返回图例标记类型,下面是这个自定义槽函数do_legendmarkerclicked()的代码:
void mainwindow::do_legendmarkerclicked()
{
 qlegendmarker* marker= qobject_cast<qlegendmarker*> (sender());
 marker->series()->setvisible(!marker->series()->isvisible()); //序列的可见性
 marker->setvisible(true); //图例标记总是可见的
 qreal alpha= 1.0;
 if (!marker->series()->isvisible())
 alpha= 0.5; //设置为半透明表示序列不可见
 qbrush brush= marker->labelbrush();
 qcolor color= brush.color();
 color.setalphaf(alpha);
 brush.setcolor(color);
 marker->setlabelbrush(brush); //设置文字的 brush
 brush= marker->brush();
 color= brush.color();
 color.setalphaf(alpha);
 brush.setcolor(color);
 marker->setbrush(brush); //设置图例标记的 brush
}
序列的 hovered()和 clicked()信号的处理
两个序列的 hovered()信号关联同一个槽函数 do_series_hovered(),这个函数的代码如下:
void mainwindow::do_series_hovered(const qpointf &point, bool state)
{
 qstring str= "series x=, y=";
 if (state)
 str= qstring::asprintf("hovered x=%.1f,y=%.2f",point.x(),point.y());
 lab_hoverxy->settext(str); //状态栏显示
 qlineseries *series= qobject_cast<qlineseries*> (sender()); //获取信号发射者
 qpen pen= series->pen();
 if (state)
 pen.setcolor(qt::red); //鼠标光标移入序列,序列变成红色
 else
 pen.setcolor(qt::black); //鼠标光标移出序列,序列恢复为黑色
 series->setpen(pen);
}
void mainwindow::do_series_clicked(const qpointf &point)
{
 	qstring str= qstring::asprintf("clicked x=%.1f,y=%.2f",point.x(),point.y());
 	lab_clickxy->settext(str); //状态栏显示
 	qlineseries *series= qobject_cast<qlineseries*> (sender()); //获取信号发射者
     int index= getindexfromx(series, point.x()); //获取数据点序号
     if (index<0)
     return;
     bool isselected= series->ispointselected(index); //数据点是否被选中
     series->setpointselected(index,!isselected); //设置状态,选中或取消选中
}

int mainwindow::getindexfromx(qxyseries *series, qreal xvalue, qreal tol)
{
 	qlist<qpointf> points= series->points(); //返回数据点的列表
 	int index= -1;
 for (int i=0; i<points.count(); i++)
 {
     qreal dx= xvalue - points.at(i).x();
     if (qabs(dx) <= tol)
     {
         index= i;
         break;
     }
  }
     return index; //-1 表示没有找到
}
图表的缩放和移动
tchartview 类里对鼠标事件和按键事件进行了处理,通过鼠标操作和按键操作就可以进行图表的缩放和移动,操作方式还与 qchartview 的 dragmode()和 rubberband()函数的值有关。窗口上方有两个下拉列表框用于设置拖动模式和框选模式,其代码如下:
void mainwindow::on_combodragmode_currentindexchanged(int index)
{// 设置拖动模式,dragmode,有 3 种模式: nodrag、scrollhanddrag、rubberbanddrag
 ui->chartview->setdragmode(qgraphicsview::dragmode(index));
}
void mainwindow::on_comborubberband_currentindexchanged(int index)
{//设置框选模式, rubberband
 ui->chartview->setcustomzoomrect(index == 4); //是否自定义模式
//必须有 clickthroughrubberband,才能将 clicked()信号传递给序列
 qflags<qchartview::rubberband> flags= qchartview::clickthroughrubberband;
 switch(index)
 {
 case 0:
 ui->chartview->setrubberband(qchartview::norubberband);
 return;
 case 1:
 flags |= qchartview::verticalrubberband; //垂直方向选择
 break;
 case 2:
 flags |= qchartview::horizontalrubberband; //水平方向选择
 break;
 case 3:
 case 4:
 flags |= qchartview::rectanglerubberband; //矩形框选
 }
 ui->chartview->setrubberband(flags);
}

发表评论