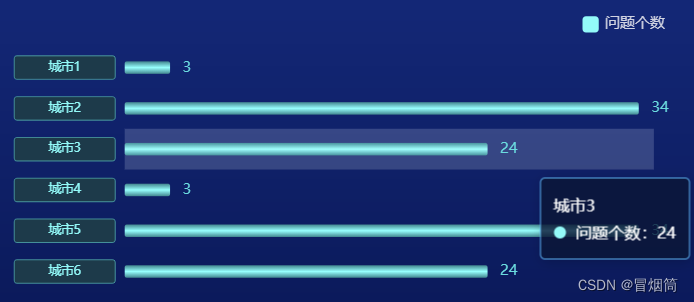
option = {
                tooltip: {
                    trigger: 'axis',
                    backgroundcolor: 'rgba(7,20,54,0.8)',
                    textstyle: {
                        color: '#fff',
                        lineheight: 100,
                        fontsize: 13,
                    },
                    bordercolor: '#42acee',
                    formatter: (params) => {
                        let html = "";
                        html += `${params[0].data.unitname}</br>`;
                        html += `<span style="display:inline-block;margin-right:4px;border-radius:10px;width:10px;height:10px;background-color:#7ffafa"></span> 问题个数:${params[0].data.value || 0} </br>`;
                        return `<div style="line-height:22px">${html}</div>`;
                    },
                    axispointer: {
                        type: 'shadow'
                    }
                },
                legend: {
                    data: ['问题个数'],
                    right: 20,
                    top: 0,
                    itemwidth: 13,
                    itemheight: 13,
                    textstyle: {
                        color: '#cfd3e2',
                        fontsize: 12,
                    },
                    itemstyle: {
                        borderwidth: 0,
                        borderradius: 0,
                        color: '#7ffafa',
                    },
                    linestyle: {
                        type: 'solid'
                    }
                },
                grid: {
                    top: '12%',
                    left: '6%',
                    right: '6%',
                    bottom: '1%',
                    containlabel: true
                },
                xaxis: {
                    show: false,
                    type: 'value',
                },
                yaxis: [{
                    type: 'category',
                    inverse: true,
                    axislabel: {
                        show: true,
                        color: '#7ffafa',
                        borderwidth: .8,
                        bordercolor: '#318f9a',
                        bordertype: 'solid',
                        height: 18,
                        width: 80,
                        // lineheight : 30,
                        fontsize: 10,
                        borderradius: 2,
                        margin: 48,
                        verticalalign: 'middle',
                        align: 'center',
                        backgroundcolor: '#163a4b',
                    },
                    splitline: {
                        show: false,
                    },
                    axistick: {
                        show: false,
                    },
                    axisline: {
                        show: false,
                    },
                    data: citydata,
                }],
                series: [
                    {
                        name: '问题个数',
                        type: 'bar',
                        barwidth: '10', // 统计条宽度
                        // bargap: '50%',
                        zlevel: 1,
                        itemstyle: {
                            color: new echarts.graphic.lineargradient(0, 0, 0, 1, [
                                {offset: 0, color: '#318690'},
                                {offset: 0.5, color: '#83fffe'},
                                {offset: 1, color: '#318690'}
                            ]),
                            borderradius: 2,
                        },
                        label: {
                            normal: {
                                color: '#4fdce0',
                                show: true,
                                distance: 10,
                                fontsize: '12',
                                position: 'right',
                            },
                        },
                        data: data1
                    },
                ],
                datazoom: [
                    {
                        type: 'inside',
                        startvalue: 0, // 从头开始。
                        yaxisindex : 0,
                        endvalue: 5, // 一次性展示n+1个。
                        zoomonmousewheel: false,  // 关闭滚轮缩放
                        moveonmousewheel: true, // 开启滚轮平移
                        moveonmousemove: true  // 鼠标移动能触发数据窗口平移
                    }
                ]
            };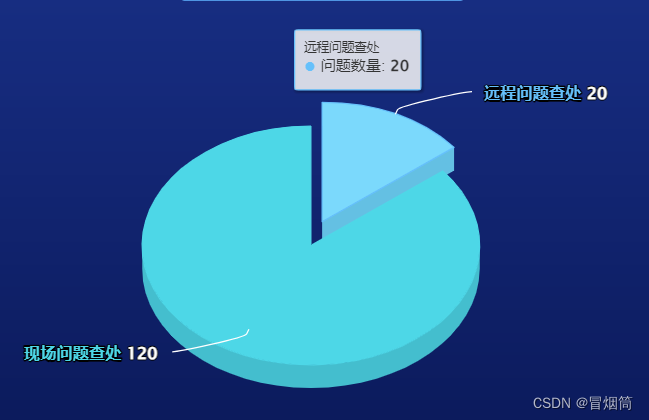
import highcharts from "highcharts";
import highcharts3d from "highcharts/highcharts-3d";
highcharts3d(highcharts);
chartoptions = {
	colors: ['#4dbfff', '#00d7e9'],
	chart: {
		type: 'pie',
		options3d: {
			enabled: true,
			alpha: 45
		},
		backgroundcolor: 'rgba(23, 31, 52, 0)'
	},
	credits: {//右下角的文本
		enabled: false,
	},
	title: {
		show: false,
		text: ''
	},
	legend: {
		align: 'center',
		verticalalign: 'middle'
	},
	plotoptions: {
		pie: {
			innersize: 0,
			datalabels: {
				// enabled: false,
				color: '#00d7e9',
				connectorcolor: '#fff',
				distance: 20,
				formatter() {
					// return this.key + " " +  this.y + " " + this.point.val + '%'
					let html = "";
					html += `<span style="color: ${this.color}">${this.key}</span> `;
					html += `<span style="color:#fff;">${this.y}</span></br>`;
					return `<div style="line-height:22px;font-size: 13px">${html}</div>`;
				},
			}
		}
	},
	series: [{
		name: '问题数量',
		type: 'pie',
		depth: 35,
		slicedoffset: 30,
		data: datalist
	}]
}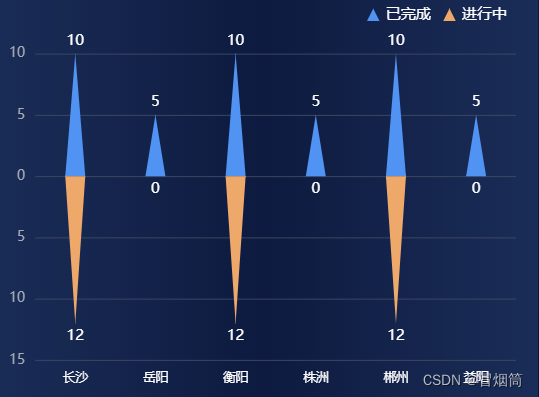
option = {
                    tooltip: {
                        trigger: 'axis',
                        backgroundcolor: 'rgba(7,20,54,0.8)',
                        textstyle: {
                            color: '#fff',
                            lineheight: 100,
                            fontsize: 13,
                        },
                        bordercolor: '#42acee',
                        formatter: (params) => {
                            let html = "";
                            html += `${params[0].data.areaname}</br>`;
                            html += `<span style="display:inline-block;margin-right:4px;border-radius:10px;width:10px;height:10px;background-color:#3a90f7"></span> 已完成:${params[0].data.value || 0} </br>`;
                            html += `<span style="display:inline-block;margin-right:4px;border-radius:10px;width:10px;height:10px;background-color:#f5a961"></span> 进行中:${math.abs(params[1].data.value) || 0} </br>`;
                            return `<div style="line-height:22px">${html}</div>`;
                        },
                        axispointer: {
                            type: 'shadow'
                        }
                    },
                    legend: {
                        data: ['已完成', '进行中'],
                        right: 20,
                        top: -4,
                        itemwidth: 10,
                        itemheight: 10,
                        borderradius: 5,
                        textstyle: {
                            color: '#fff',
                            fontsize: 12,
                        },
                    },
                    grid: {
                        top: '12%',
                        left: '4%',
                        right: '4%',
                        bottom: '4%',
                        containlabel: true
                    },
                    xaxis: {
                        type: 'category',
                        data: citydata,
                        axislabel: {
                            color: '#ffffff',
                            fontsize: 10,
                            width: 50,
                            interval: 0,
                            lineheight: 14,
                            overflow: 'break',
                            margin: 8,
                        },
                        axistick: {
                            show: false
                        },
                        axisline: {
                            show: false,
                            linestyle: {
                                width: '1',
                                color: '#465569',
                                dashoffset: 10,
                            }
                        },
                        // z: 10
                    },
                    yaxis: [
                        {
                            position: 'left',
                            axisline: {
                                show: false,
                                linestyle: {
                                    width: '1',
                                    color: '#465569',
                                    dashoffset: 10,
                                }
                            },
                            axistick: {
                                show: false
                            },
                            axislabel: {
                                fontsize: 11,
                                color: '#a8adbb',
                                formatter: function (value) {
                                    return math.abs(value) || 0;
                                }
                            },
                            splitline: {
                                show: true,
                                linestyle: {
                                    width: '0.8',
                                    color: '#384564',
                                    dashoffset: 10,
                                    // type: 'dashed'
                                }
                            },
                        },
                    ],
                    series: [
                        {
                            name: '已完成',
                            type: 'pictorialbar',
                            symbol: 'path://m0,10 l10,10 l5,0 l0,10 z',
                            barwidth: '16', // 统计条宽度
                            bargap: '50%',
                            itemstyle: {
                                color: '#3a90f7',
                            },
                            label: {
                                color: '#ffffff',
                                show: true,
                                distance: 4,
                                fontsize: '12',
                                position: 'top',
                            },
                            stack: 'one',
                            data: data1
                        },
                        {
                            name: '进行中',
                            type: 'pictorialbar',
                            symbol: 'path://m0,10 l10,10 l5,0 l0,10 z',
                            barwidth: '16', // 统计条宽度
                            itemstyle: {
                                color: '#f5a961',
                                borderradius: 4,
                            },
                            label: {
                                color: '#ffffff',
                                show: true,
                                distance: 4,
                                fontsize: '12',
                                position: 'bottom',
                                formatter: function (params) {
                                    return params.data.ingtolmple ? math.abs(params.data.ingtolmple) : 0;
                                }
                            },
                            stack: 'one',
                            data: data2
                        },
                    ],
                    datazoom: [
                        {
                            type: 'inside',
                            startvalue: 0, // 从头开始。
                            endvalue: 9, // 一次性展示n+1个。
                            zoomonmousewheel: false,  // 关闭滚轮缩放
                            moveonmousewheel: true, // 开启滚轮平移
                            moveonmousemove: true  // 鼠标移动能触发数据窗口平移
                        }
                    ]
                };
更新中...

发表评论