微信小程序中如何绘制天气折线图?下面本篇文章就来给大家介绍一下在微信小程序中使用canvas绘制天气折线图的方法,以及使用三阶贝塞尔曲线拟合温度点,使之变得圆滑,曲线底部有背景色,希望对大家有所帮助!

折线
效果图:
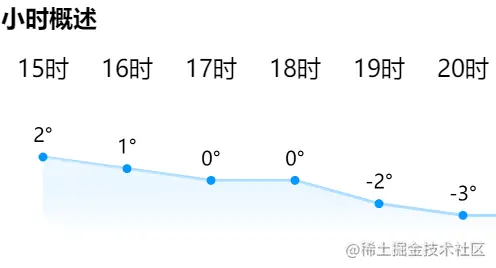
自定义组件 line-chart
<canvas></canvas>
component({
  externalclasses: ['line-class'],
  properties: {
    width: string,
    height: string,
    data: array,
  },
  observers: {
    width() {
      // 这里监听 width 变化重绘 canvas
      // 动态传入 width 好像只能这样了..
      const query = this.createselectorquery();
      query
        .select('#line')
        .fields({ node: true, size: true })
        .exec(res => {
          const canvas = res[0].node;
          const ctx = canvas.getcontext('2d');
          const width = res[0].width; // 画布宽度
          const height = res[0].height; // 画布高度

          console.log(`宽度: ${width}, 高度: ${height}`);

          const dpr = wx.getsysteminfosync().pixelratio;
          canvas.width = width * dpr;
          canvas.height = height * dpr;
          ctx.scale(dpr, dpr);

          // 开始绘图
          this.drawline(ctx, width, height, this.data.data);
        });
    },
  },
  methods: {
    drawline(ctx, width, height, data) {
      const max = math.max(...data);
      const min = math.min(...data);

      // 把 canvas 的宽度, 高度按一定规则平分
      const startx = width / (data.length * 2), // 起始点的横坐标 x
        basey = height * 0.9, // 基线纵坐标 y
        diffx = width / data.length,
        diffy = (height * 0.7) / (max - min); // 高度预留 0.2 写温度

      ctx.beginpath();
      ctx.textalign = 'center';
      ctx.font = '13px microsoft yahei';
      ctx.linewidth = 2;
      ctx.strokestyle = '#abdcff';

      // 画折线图的线
      data.foreach((item, index) => {
        const x = startx + diffx * index,
          y = basey - (item - min) * diffy;

        ctx.filltext(`${item}°`, x, y - 10);
        ctx.lineto(x, y);
      });
      ctx.stroke();

      // 画折线图背景
      ctx.lineto(startx + (data.length - 1) * diffx, basey); // 基线终点
      ctx.lineto(startx, basey); // 基线起点
      const lingrad = ctx.createlineargradient(0, 0, 0, height * 0.7);
      lingrad.addcolorstop(0, 'rgba(255,255,255,0.9)');
      lingrad.addcolorstop(1, 'rgba(171,220,255,0)');
      ctx.fillstyle = lingrad;
      ctx.fill();

      // 画折线图上的小圆点
      ctx.beginpath();
      data.foreach((item, index) => {
        const x = startx + diffx * index,
          y = basey - (item - min) * diffy;

        ctx.moveto(x, y);
        ctx.arc(x, y, 3, 0, 2 * math.pi);
      });
      ctx.fillstyle = '#0396ff';
      ctx.fill();
    },
  },
});data 就是温度数组,如 [1, 2, ...]
因为不知道温度数值有多少个,因此这里的 width 动态传入
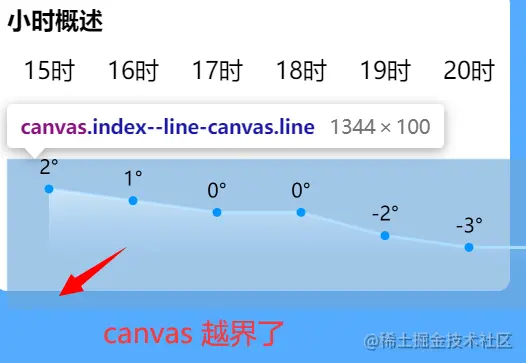
有个小问题,就是宽度过大的话真机不会显示...
 // 获取 scroll-view 的总宽度
 wx.createselectorquery()
      .select('.hourly')
      .boundingclientrect(rect => {
        this.setdata({
          scrollwidth: rect.right - rect.left,
        });
      })
.exec();<view>小时概述</view><scroll-view>
<view>
<view>{{item}}</view>
</view>
<line-chart></line-chart></scroll-view>这里写 scroll-x 和 scroll-y,要不会出现绝对定位偏移的问题,也不知道为什么
.scroll {
  position: relative;
  height: 150px;
  width: 100%;
}

.hourly {
  display: flex;
  height: 150px;
  position: absolute;
  top: 0;
}

.hourly > view {
  min-width: 3.5em;
  text-align: center;
}

.line { // 折线图绝对定位到底部
  position: absolute;
  bottom: 0;
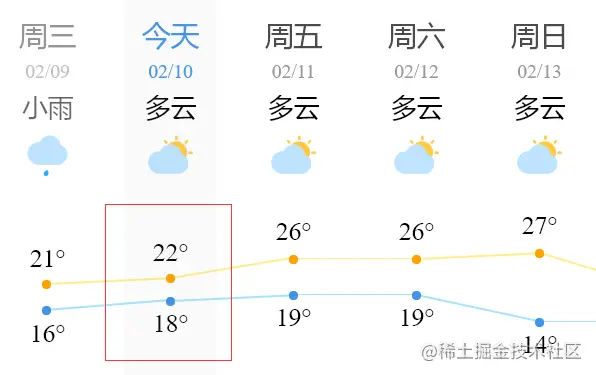
}这里使用绝对定位其实是想模拟墨迹天气这种折线图和每一天在一个块内的效果,所以 hourly 要和 scroll-view 等高,canvas 需要定位一下
主要是不知道墨迹天气怎么实现的,只能暂时这样
三阶贝塞尔曲线
效果图
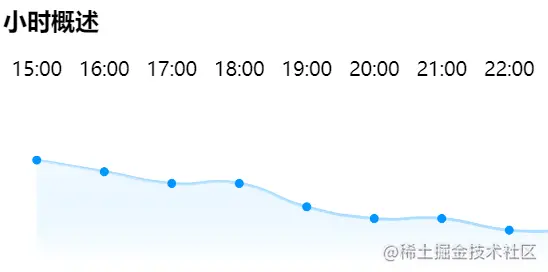
emmm,好像并不怎么圆滑
计算控制点
首先写一个点类
class point {
  constructor(x, y) {
    this.x = x;
    this.y = y;
  }
}canvas贝塞尔曲线绘制工具 (karlew.com)http://wx.karlew.com/canvas/bezier/
通过上面这个网站可以知道三阶贝塞尔曲线各个参数的意义
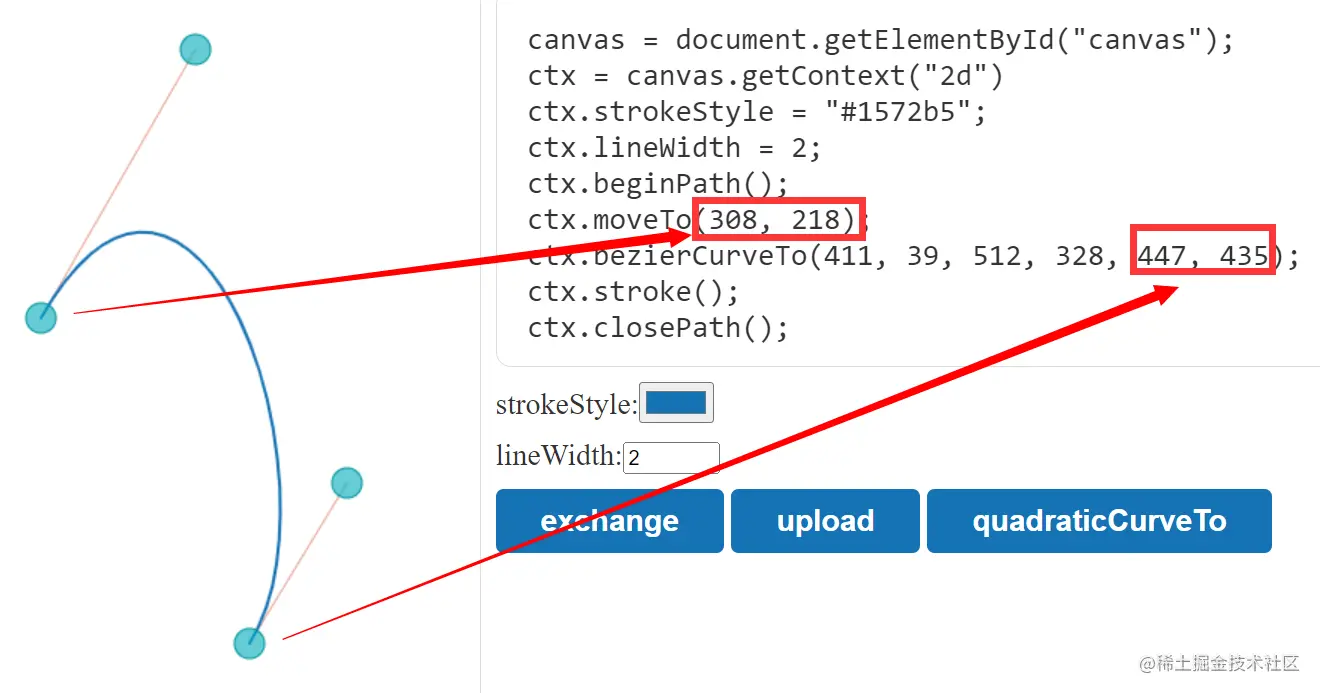
也就是使用 beziercurveto 的时候最后一个点是下一个点,前两个是控制点
控制点的计算参考: 贝塞尔曲线控制点确定的方法 - 百度文库
https://wenku.baidu.com/view/c790f8d46bec0975f565e211.html
浓缩一下就是
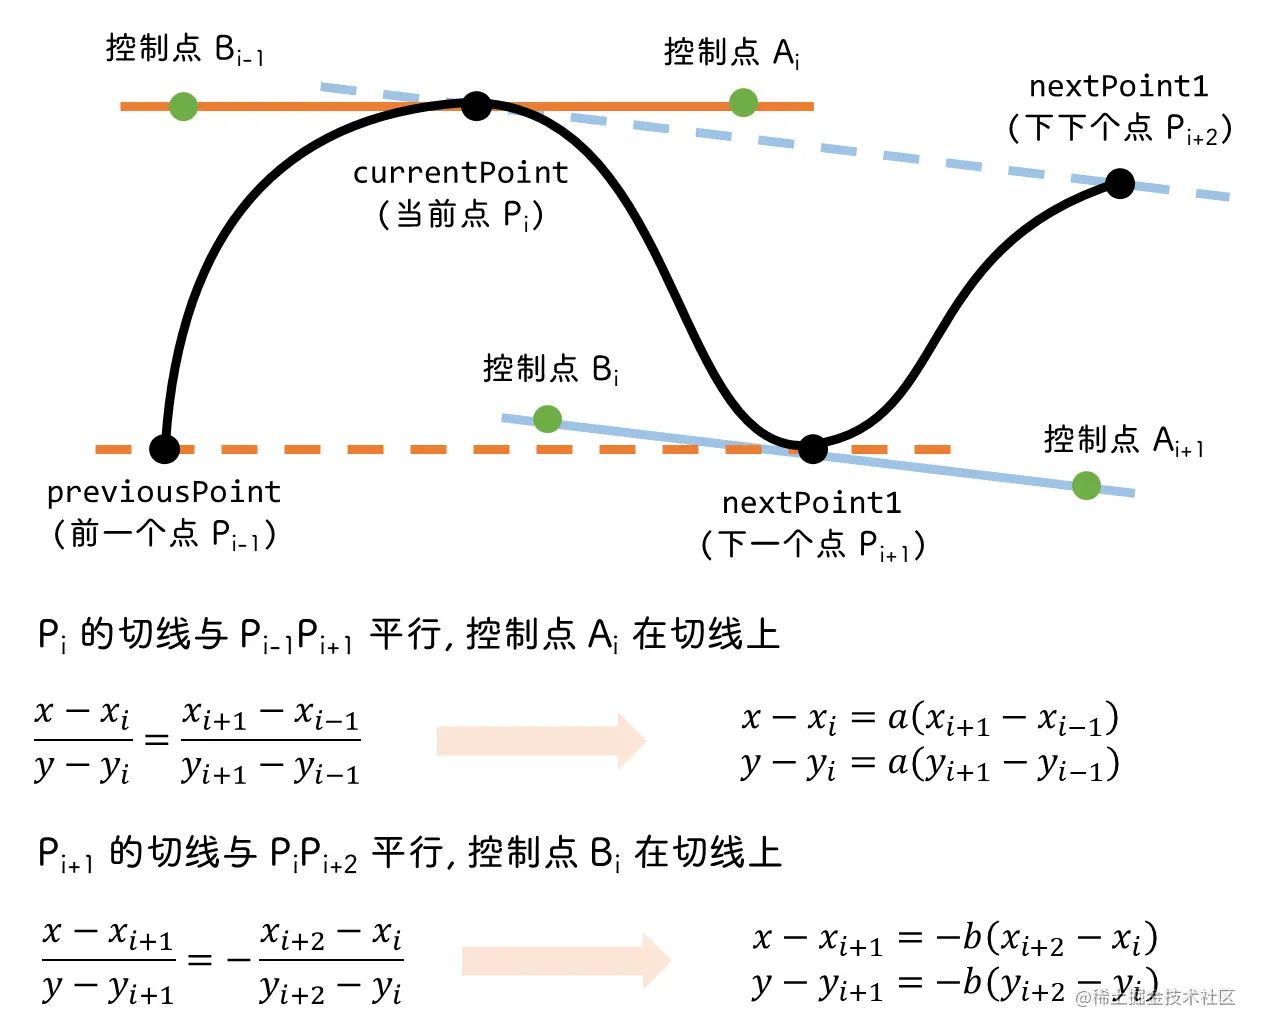
这里的 a 和 b 可以是任意正数
因此定义一个计算某点的控制点 a 和 b 的方法
/**
 * 计算当前点的贝塞尔曲线控制点
 * @param {point} previouspoint: 前一个点
 * @param {point} currentpoint: 当前点
 * @param {point} nextpoint1: 下一个点
 * @param {point} nextpoint2: 下下个点
 * @param {number} scale: 系数
 */
calcbeziercontrolpoints(
  previouspoint,
  currentpoint,
  nextpoint1,
  nextpoint2,
  scale = 0.25
) {
  let x = currentpoint.x + scale * (nextpoint1.x - previouspoint.x);
  let y = currentpoint.y + scale * (nextpoint1.y - previouspoint.y);

  const controlpointa = new point(x, y); // 控制点 a

  x = nextpoint1.x - scale * (nextpoint2.x - currentpoint.x);
  y = nextpoint1.y - scale * (nextpoint2.y - currentpoint.y);

  const controlpointb = new point(x, y); // 控制点 b

  return { controlpointa, controlpointb };
}这里 scale 就是 a 和 b,不过将它们的取值相等
但是第一个点没有 previouspoint,倒数第二个点没有 nextpoint2
因此当点是第一个的时候,使用 currentpoint 代替 previouspoint
当倒数第二个点的时候,使用 nextpoint1 代替 nextpoint2

至于最后一个点,不需要做任何事,因为 beziercurveto 第三个参数就是下一个点,只需要提供坐标就能连起来,不需要计算控制点
因此绘制三阶贝塞尔曲线的方法:
/**
 * 绘制贝塞尔曲线
 * ctx.beziercurveto(控制点1, 控制点2, 当前点);
 */
drawbezierline(ctx, data, options) {
  const { startx, diffx, basey, diffy, min } = options;

  ctx.beginpath();
  // 先移动到第一个点
  ctx.moveto(startx, basey - (data[0] - min) * diffy);

  data.foreach((e, i) => {
    let curpoint, prepoint, nextpoint1, nextpoint2, x, y;

    // 当前点
    x = startx + diffx * i;
    y = basey - (e - min) * diffy;
    curpoint = new point(x, y);

    // 前一个点
    x = startx + diffx * (i - 1);
    y = basey - (data[i - 1] - min) * diffy;
    prepoint = new point(x, y);

    // 下一个点
    x = startx + diffx * (i + 1);
    y = basey - (data[i + 1] - min) * diffy;
    nextpoint1 = new point(x, y);

    // 下下个点
    x = startx + diffx * (i + 2);
    y = basey - (data[i + 2] - min) * diffy;
    nextpoint2 = new point(x, y);

    if (i === 0) {
      // 如果是第一个点, 则前一个点用当前点代替
      prepoint = curpoint;
    } else if (i === data.length - 2) {
      // 如果是倒数第二个点, 则下下个点用下一个点代替
      nextpoint2 = nextpoint1;
    } else if (i === data.length - 1) {
      // 最后一个点直接退出
      return;
    }

    const { controlpointa, controlpointb } = this.calcbeziercontrolpoints(
      prepoint,
      curpoint,
      nextpoint1,
      nextpoint2
    );

    ctx.beziercurveto(
      controlpointa.x,
      controlpointa.y,
      controlpointb.x,
      controlpointb.y,
      nextpoint1.x,
      nextpoint1.y
    );
  });

  ctx.stroke();
},【相关学习推荐:小程序开发教程】
以上就是手把手教你在微信小程序中使用canvas绘制天气折线图(附代码)的详细内容,更多请关注代码网其它相关文章!


发表评论