背景
对于php的调试,一般来说我们用 echo 和 var_dump 就够用了。
有时会碰到要解决复杂的逻辑或需要确认代码的运行顺序,这里用var_dump效率就比较低了,这时建议用断点的方式进行代码调试。
这里通过 xdebug 配合vscode 的 php debug插件来实现。
配置步骤
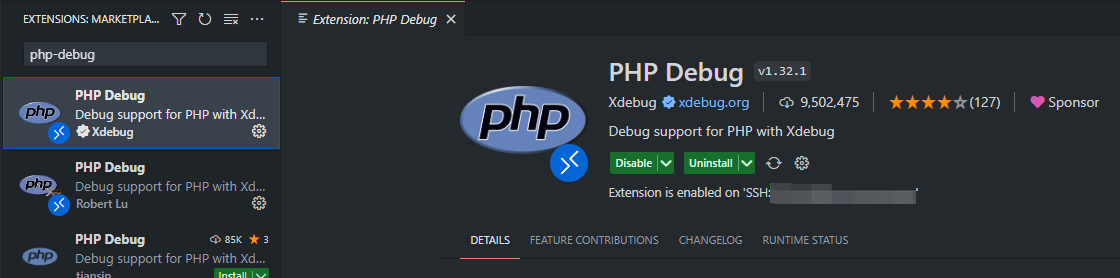
1. 安装 php debug 插件
在vs code中安装php debug插件
这时会在你的项目的 .vscode 目录下生成 launch.json 文件:
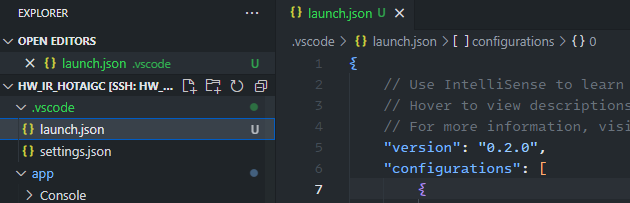
文件内容如下:
{
    // use intellisense to learn about possible attributes.
    // hover to view descriptions of existing attributes.
    // for more information, visit: https://go.microsoft.com/fwlink/?linkid=830387
    "version": "0.2.0",
    "configurations": [
        {
            "name": "launch built-in server and debug",
            "type": "php",
            "request": "launch",
            "runtimeargs": [
                "-s",
                "localhost:8000",
                "-t",
                "."
            ],
            "port": 9003,
            "serverreadyaction": {
                "action": "openexternally"
            }
        },
        {
            "name": "debug current script in console",
            "type": "php",
            "request": "launch",
            "program": "${file}",
            "cwd": "${filedirname}",
            "externalconsole": false,
            "port": 9003
        },
        {
            "name": "listen for xdebug",
            "type": "php",
            "request": "launch",
            "port": 9003
        }
    ]
}
这里定义了三种调度模式:
launch built-in server and debug:适合没有web server的环境,这种模式会用内置的 php 调试器启动一个简单的 php web 服务器,然后在浏览器中访问 http://localhost:端口号 来访问您的 php 网站。
debug current script in console:这种是控制台模式。
listen for xdebug:这种是监听xdebug,本文采用的就是这种模式。
这里我们可以先看看控制台模式效果:
我们准备一个简单的php代码:
<?php
    $url = "https://hotaigc.cn";
    if ($url == "https://hotaigc.cn") {
        echo "success";
    } else {
        echo "error";
    }
我们在if这里打个断点,运行效果如图:
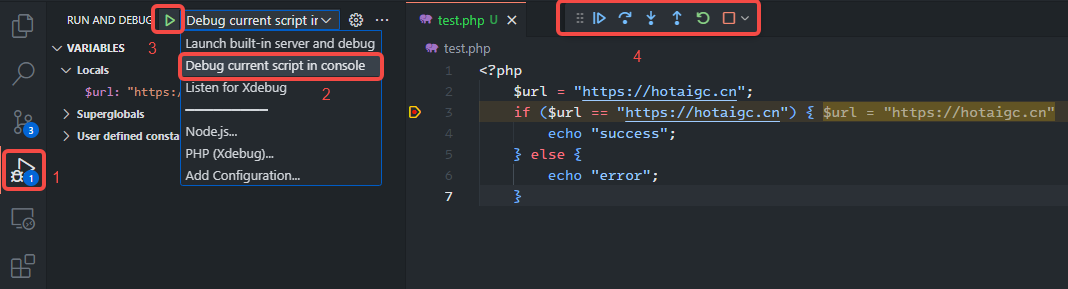
然后打开调试面板(图中1),选择 debug current script in console(图中2),然后点运行(图中3),就可以看到调试的效果
2. 安装 xdebug
在远程服务器上安装 xdebug,我的是 ubuntu 20.4 环境,用 apt-get 安装就可以了:
sudo apt-get install php8.1-xdebug
其他系统参考这里:https://xdebug.org/docs/install
这里需要注意的是xdebug需要跟php的版本保持一致,你可以通过 phpinfo()来确认你的php版本。

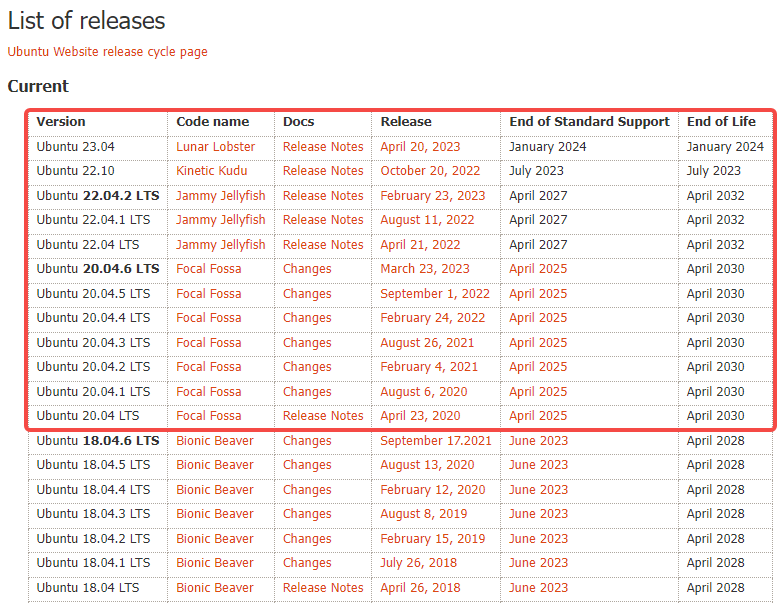
还有一个易出错的点是部分ubuntu版本会提示找不到xdebug包,这是因为一般都用这个ppa库进行安装( https://launchpad.net/~ondrej/+archive/ubuntu/php ),但这个库已经不支持 ubuntu 20 以下的版本,具体见:
https://wiki.ubuntu.com/releases
如下图,红框以下的都已经不支持了,只能自己想办法从源码编译了:
3. 在php.ini中进行配置
找到 php.ini 的路径,可以从 phpinfo() 中找:

然后添加如下参数:
[xdebug]
# 根据扩展实际存放路径填写
zend_extension=xdebug
;xdebug3.0中用于代替之前的xdebug.remote_enable=on
xdebug.mode=debug
;xdebug3.0中用于代替之前的xdebug.remote_autostart,trigger对应之前的off,yes对应之前的on
xdebug.start_with_request=trigger
;xdebug3.0中用于代替之前的xdebug.remote_host
xdebug.client_host="127.0.0.1"
;xdebug3.0中用于代替之前的xdebug.remote_connect_back=on,它会自动从$_server['http_x_forwarded_for']
;或$_server['remote_addr']变量中获取ip,当然因为$_server只有服务器模式有所以客户端模式是用不了的(可配置其它变量)
;如果找不到ip它会回退(fallback)到xdebug.client_host指定的ip
xdebug.discover_client_host=true
;xdebug3.0中用于代替之前的xdebug.remote_port
xdebug.client_port=9003
;固定填dbgp(因为目前只支持这个协议,也只有这个协议)
xdebug.remote_handler="dbgp"
;这是一个所有网上的文章都提到要设置但实际上却没啥用的参数(不信你可以注释掉试试,一切都正常)
xdebug.idekey="phpstorm"
这里需要注意的是 xdebug 的 3.x 版本和 2.x 版本参数是不一样的。
开始调试
1. 打断点
这次我们写一个简单的 controller 代码(注,我这里用的是laravel),还是在if这里加个断点(在vs code的行号左边点击一下即可):
class commoncontroller extends controller
{
    public function test(request $request) {
        $a = 1;
        if ($a == 1) {
            return phpinfo();
        }
        return 1;
    }
}
2. 启动调试
选择listen for xdebug调试模式,然后启动调试(第3张图中有示例)
3. 在浏览器中打开页面
在浏览器中打开会运行该 controller 方法的页面(这里涉及到一些laravel细节,不展开讲),正常情况这时浏览器页面会停在加载中状态,等待调试。
4. 进行调试
这时打开 vs code,会看到代码执行到断点这里停住了,我们可以看到变量,调用堆栈,调试工具栏等信息,如下图所示:

到此这篇关于在vs code 中调试远程服务器的php代码的文章就介绍到这了,更多相关vs code 调试远程服务器内容请搜索代码网以前的文章或继续浏览下面的相关文章希望大家以后多多支持代码网!


发表评论